
使用 Grafana 轻松监控 TensorFlow Serving
使用 Grafana Cloud 的开箱即用监控解决方案,轻松监控机器学习开源平台 TensorFlow Serving。Grafana Cloud 的永久免费层包含 3 个用户和高达 1 万指标系列,以满足您的监控需求。
包括的关键指标
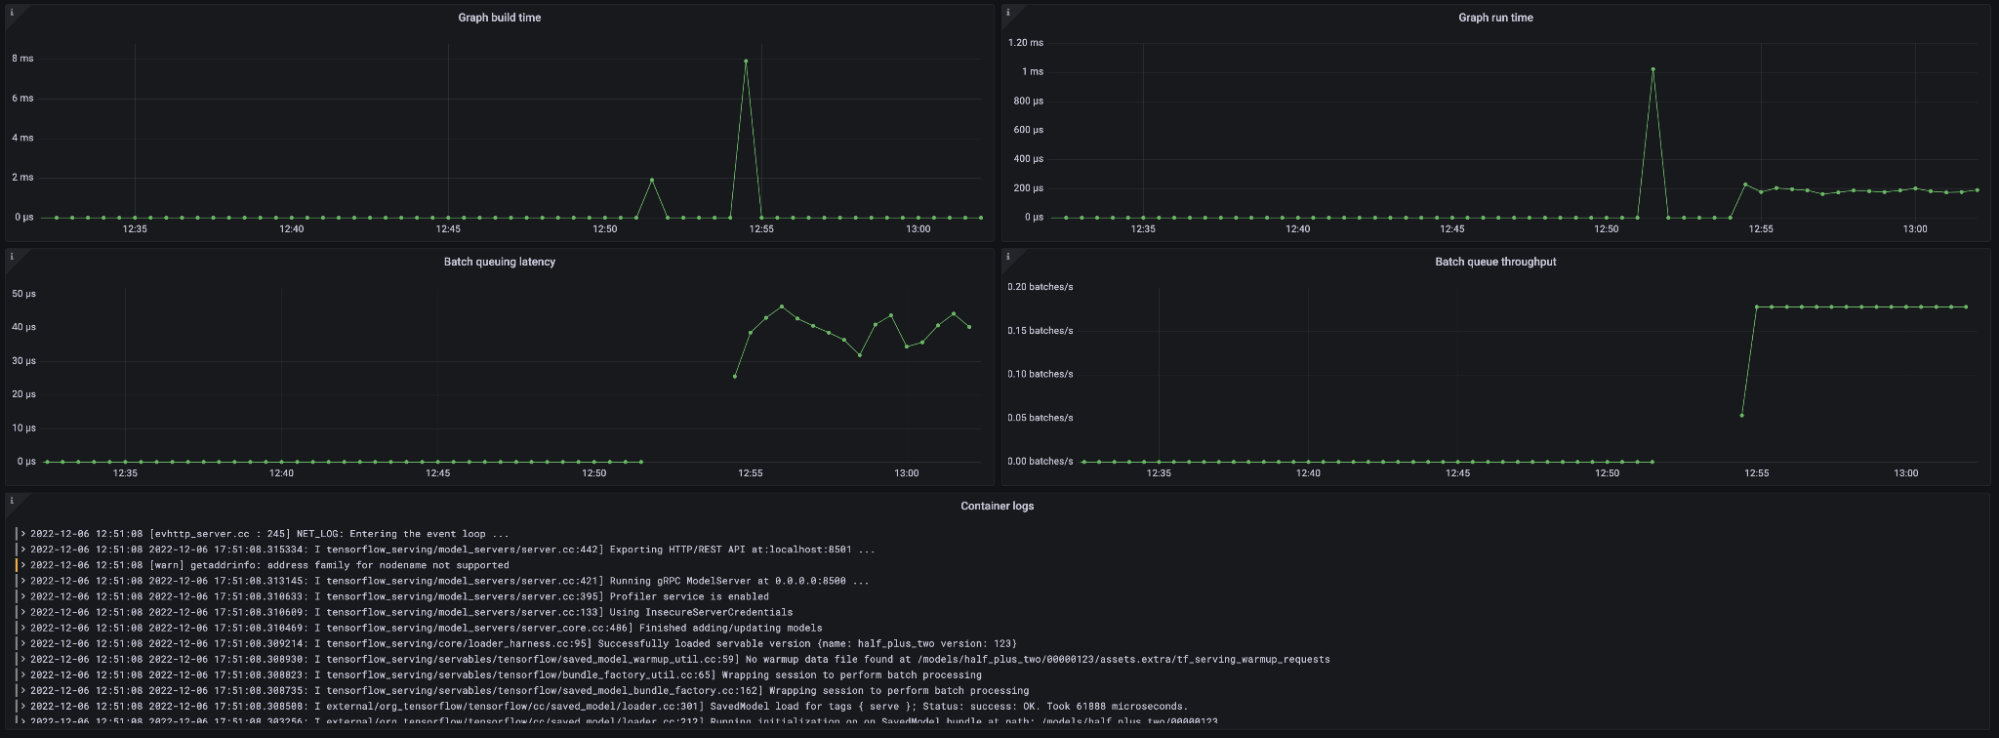
:tensorflow:core:graph_build_calls
:tensorflow:core:graph_build_time_usecs
:tensorflow:core:graph_run_time_usecs
:tensorflow:core:graph_runs
:tensorflow:serving:batching_session:queuing_latency_count
:tensorflow:serving:batching_session:queuing_latency_sum
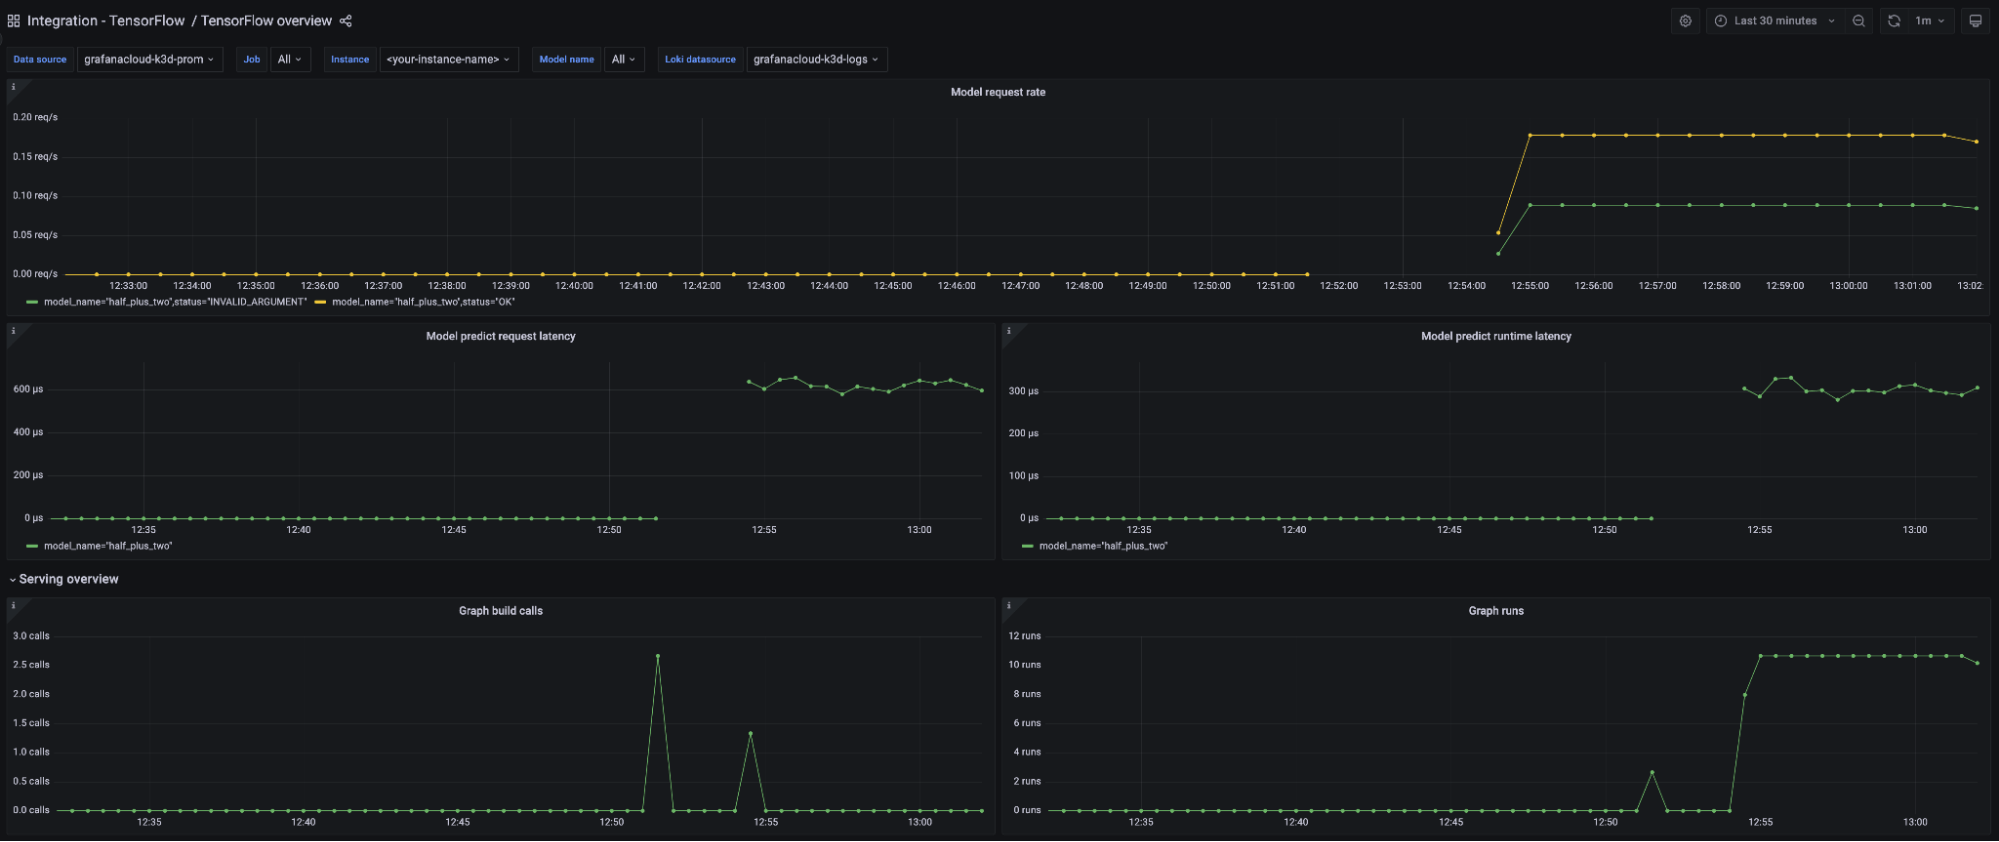
:tensorflow:serving:request_count
:tensorflow:serving:request_latency_count
:tensorflow:serving:request_latency_sum
:tensorflow:serving:runtime_latency_count
:tensorflow:serving:runtime_latency_sum
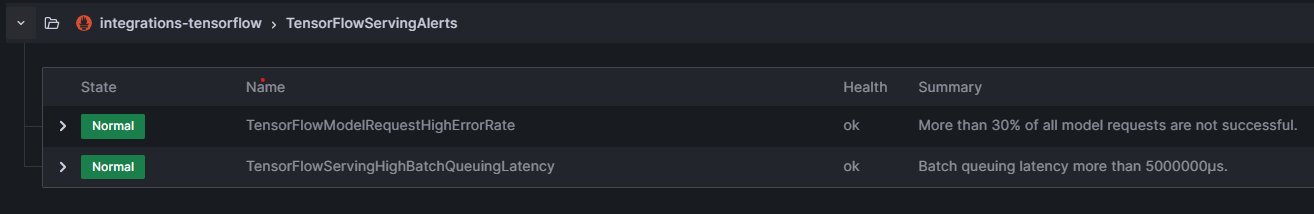
包括的关键警报规则
TensorFlowModelRequestHighErrorRate
TensorFlowServingHighBatchQueuingLatency