
使用 Grafana 轻松监控 Linux 服务器
使用 Grafana Cloud 开箱即用的监控解决方案轻松监控您的 Linux 操作系统部署。Grafana Cloud 永久免费套餐包含 3 个用户和多达 1 万个指标时序,以满足您的监控需求。
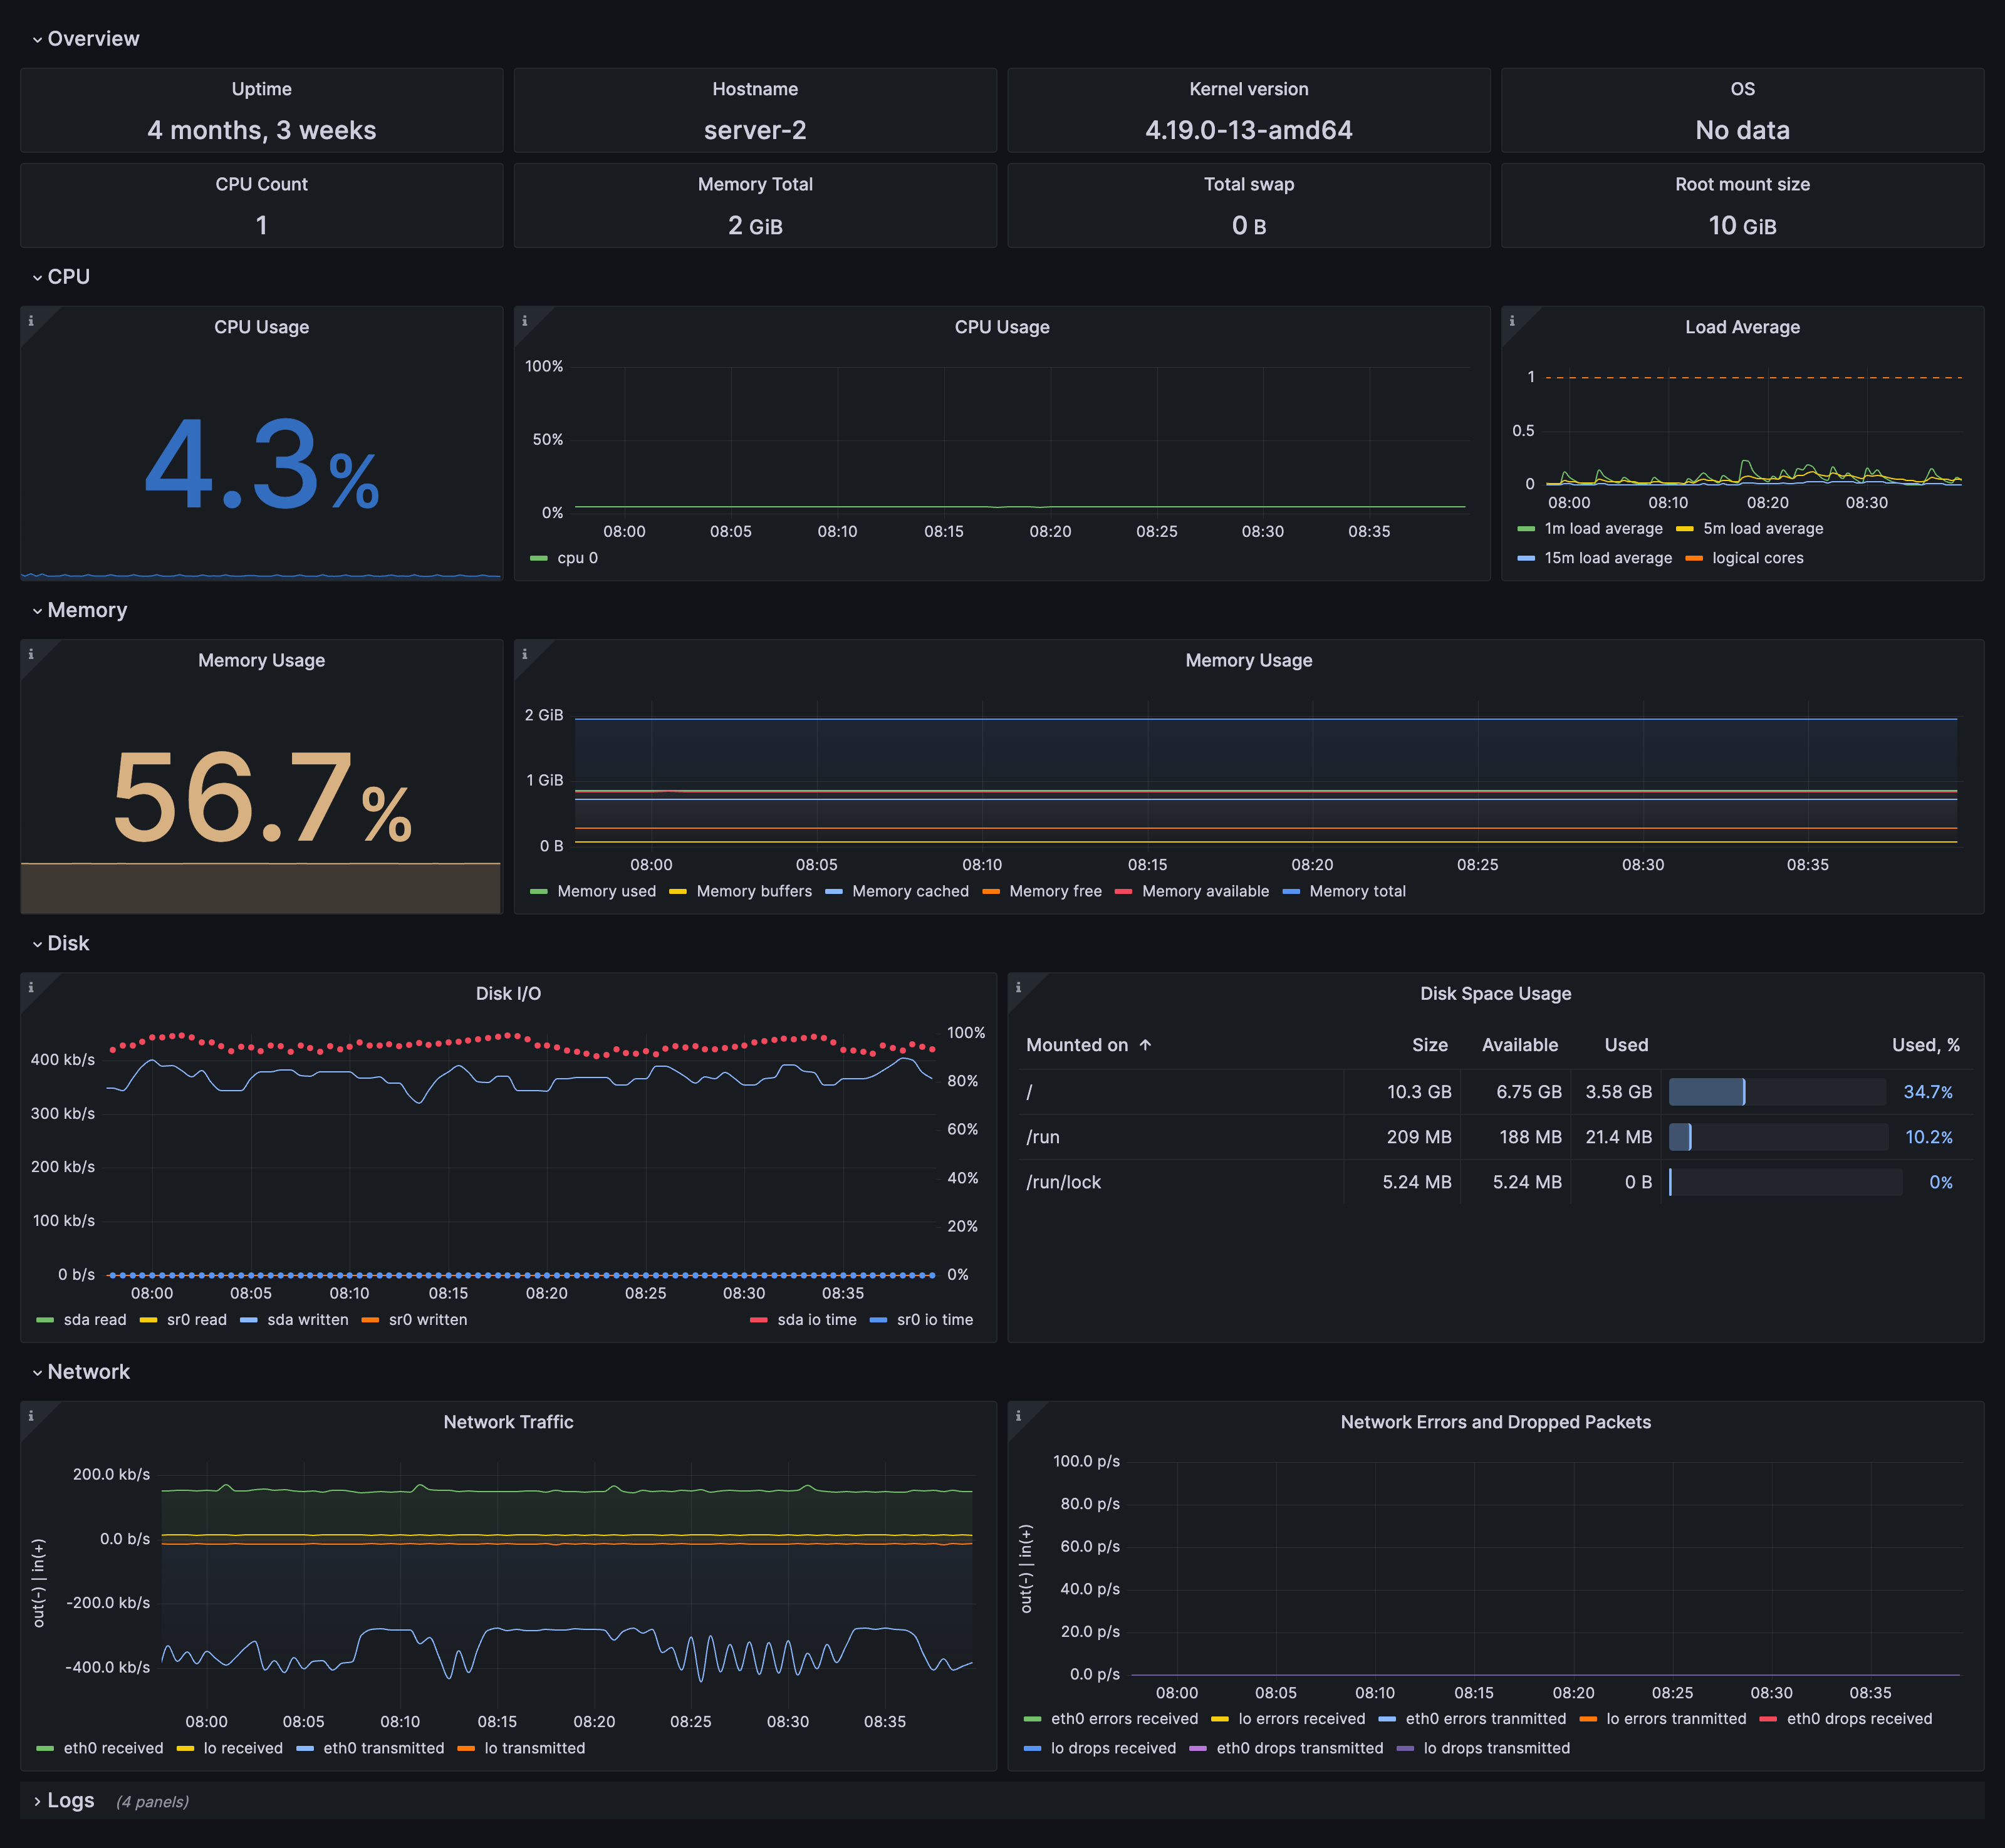
节点概览仪表盘
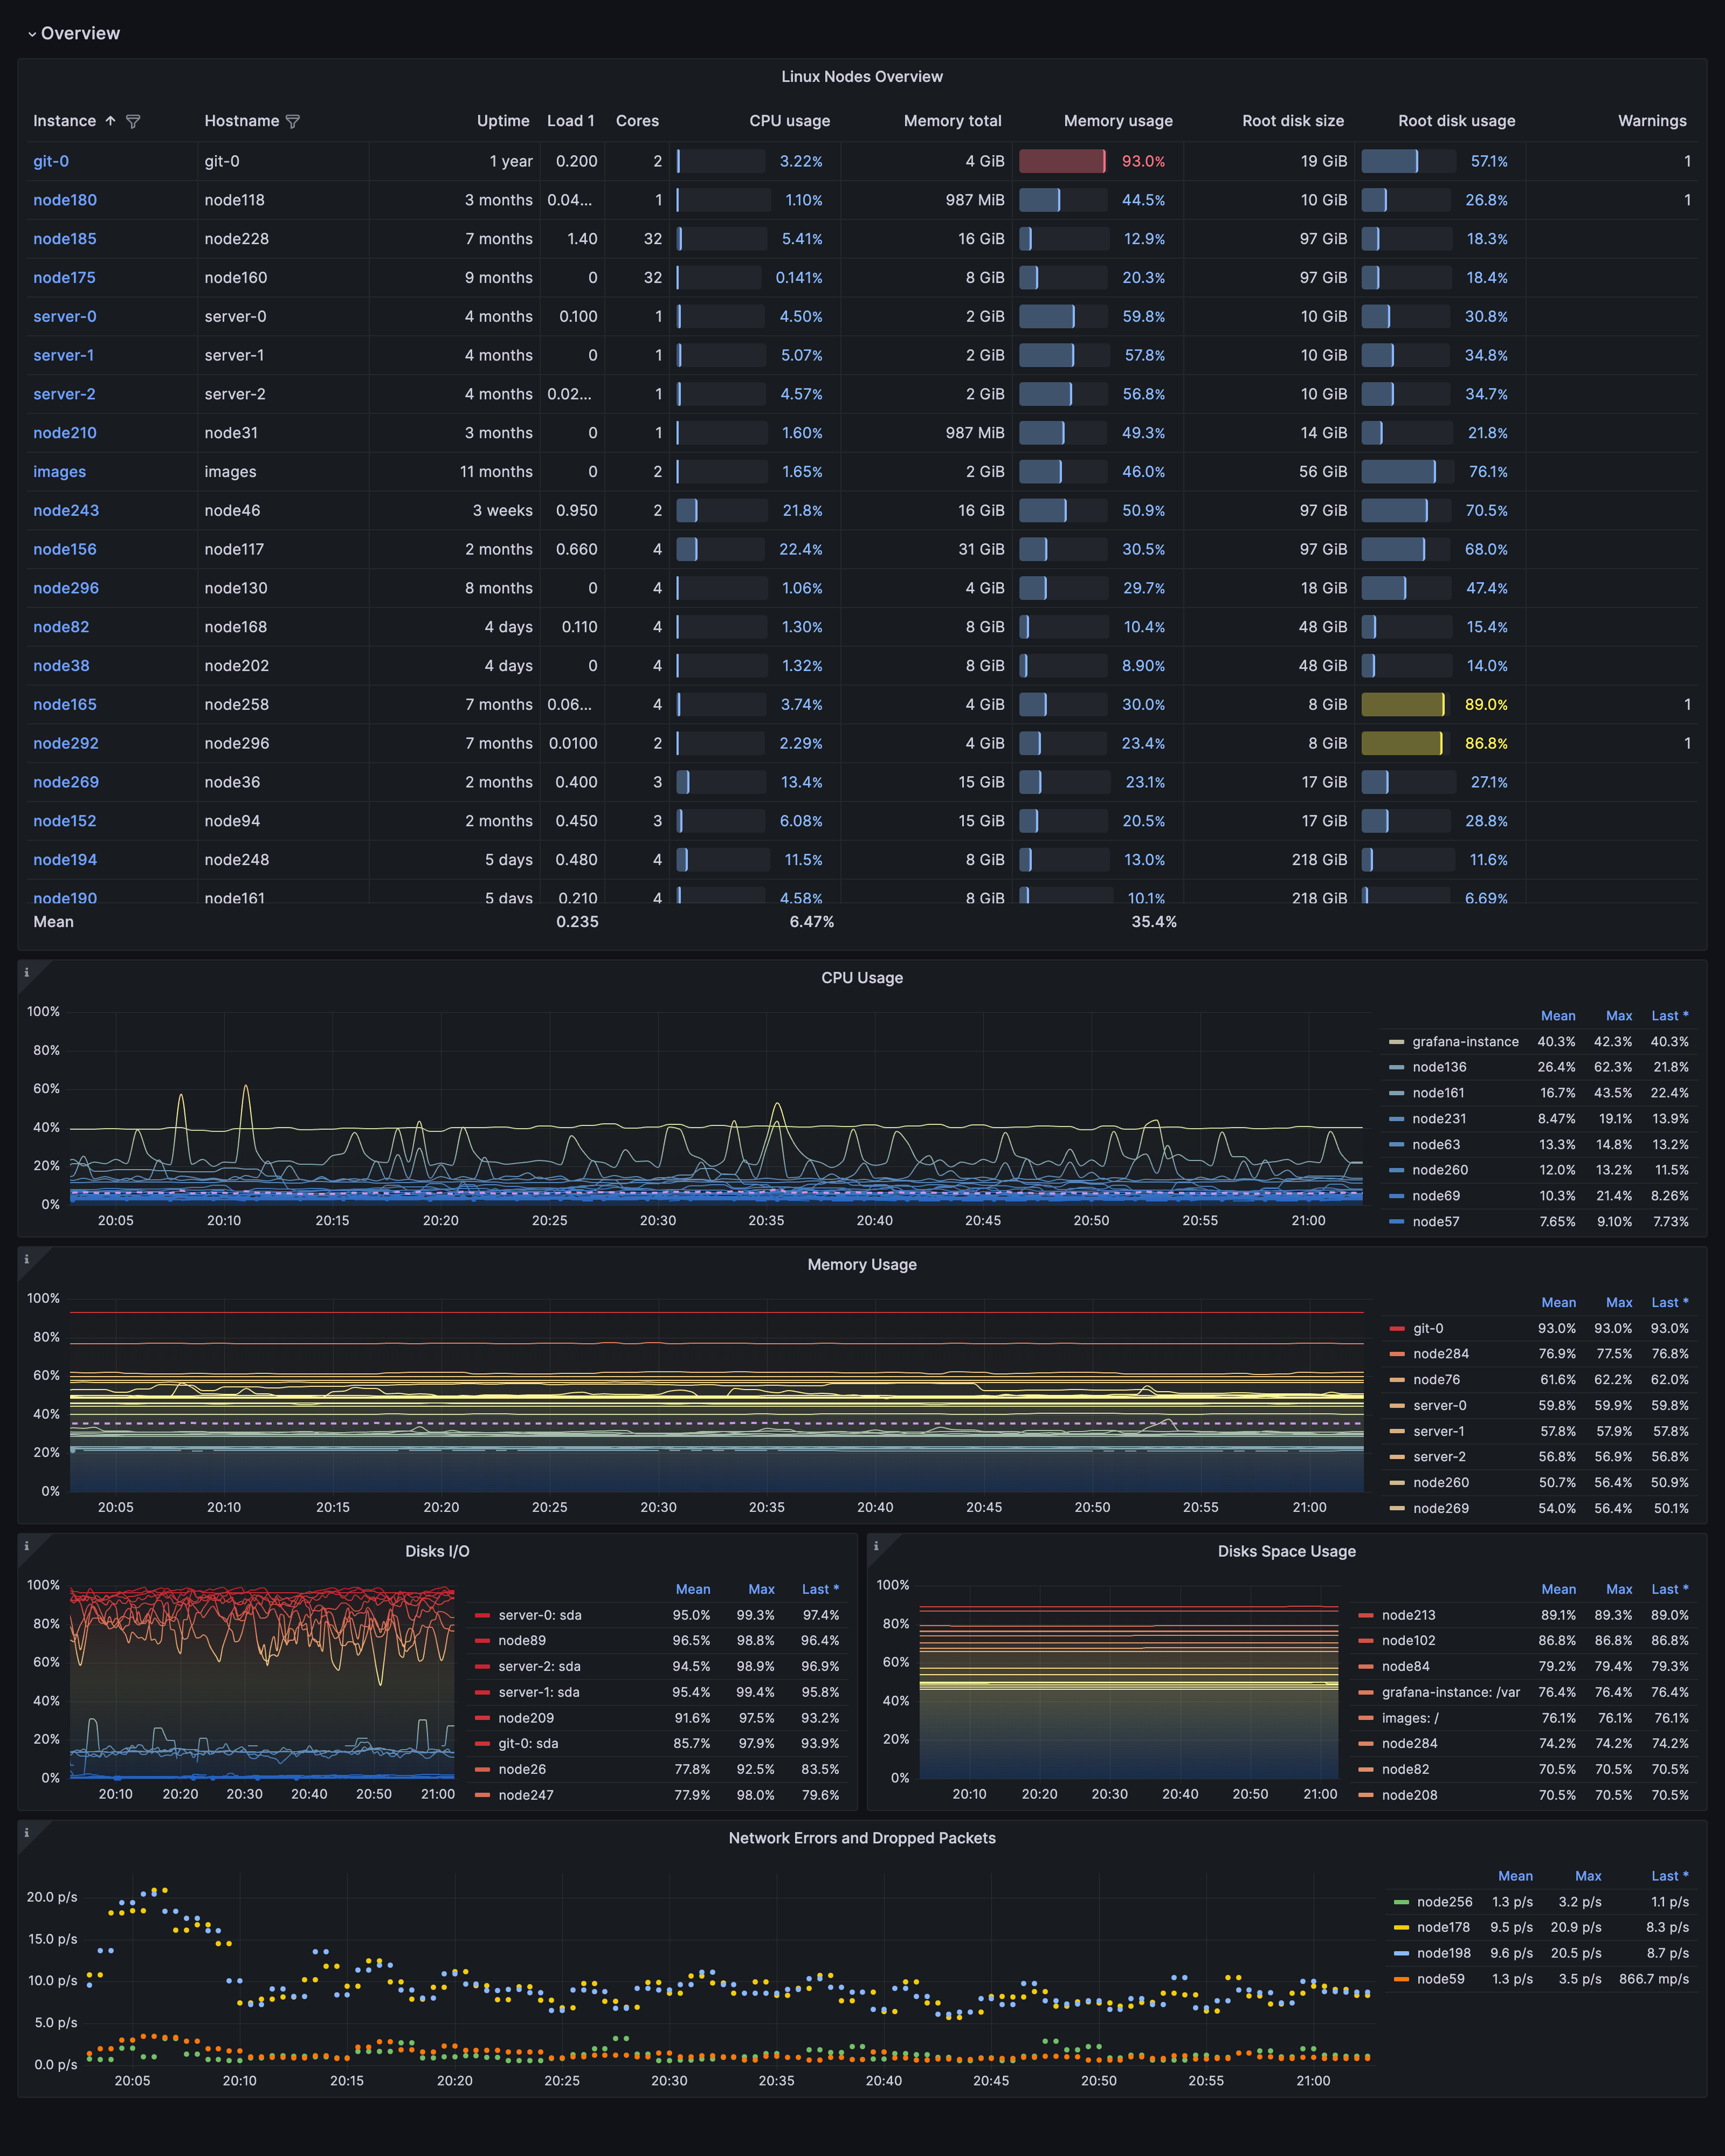
集群概览仪表盘
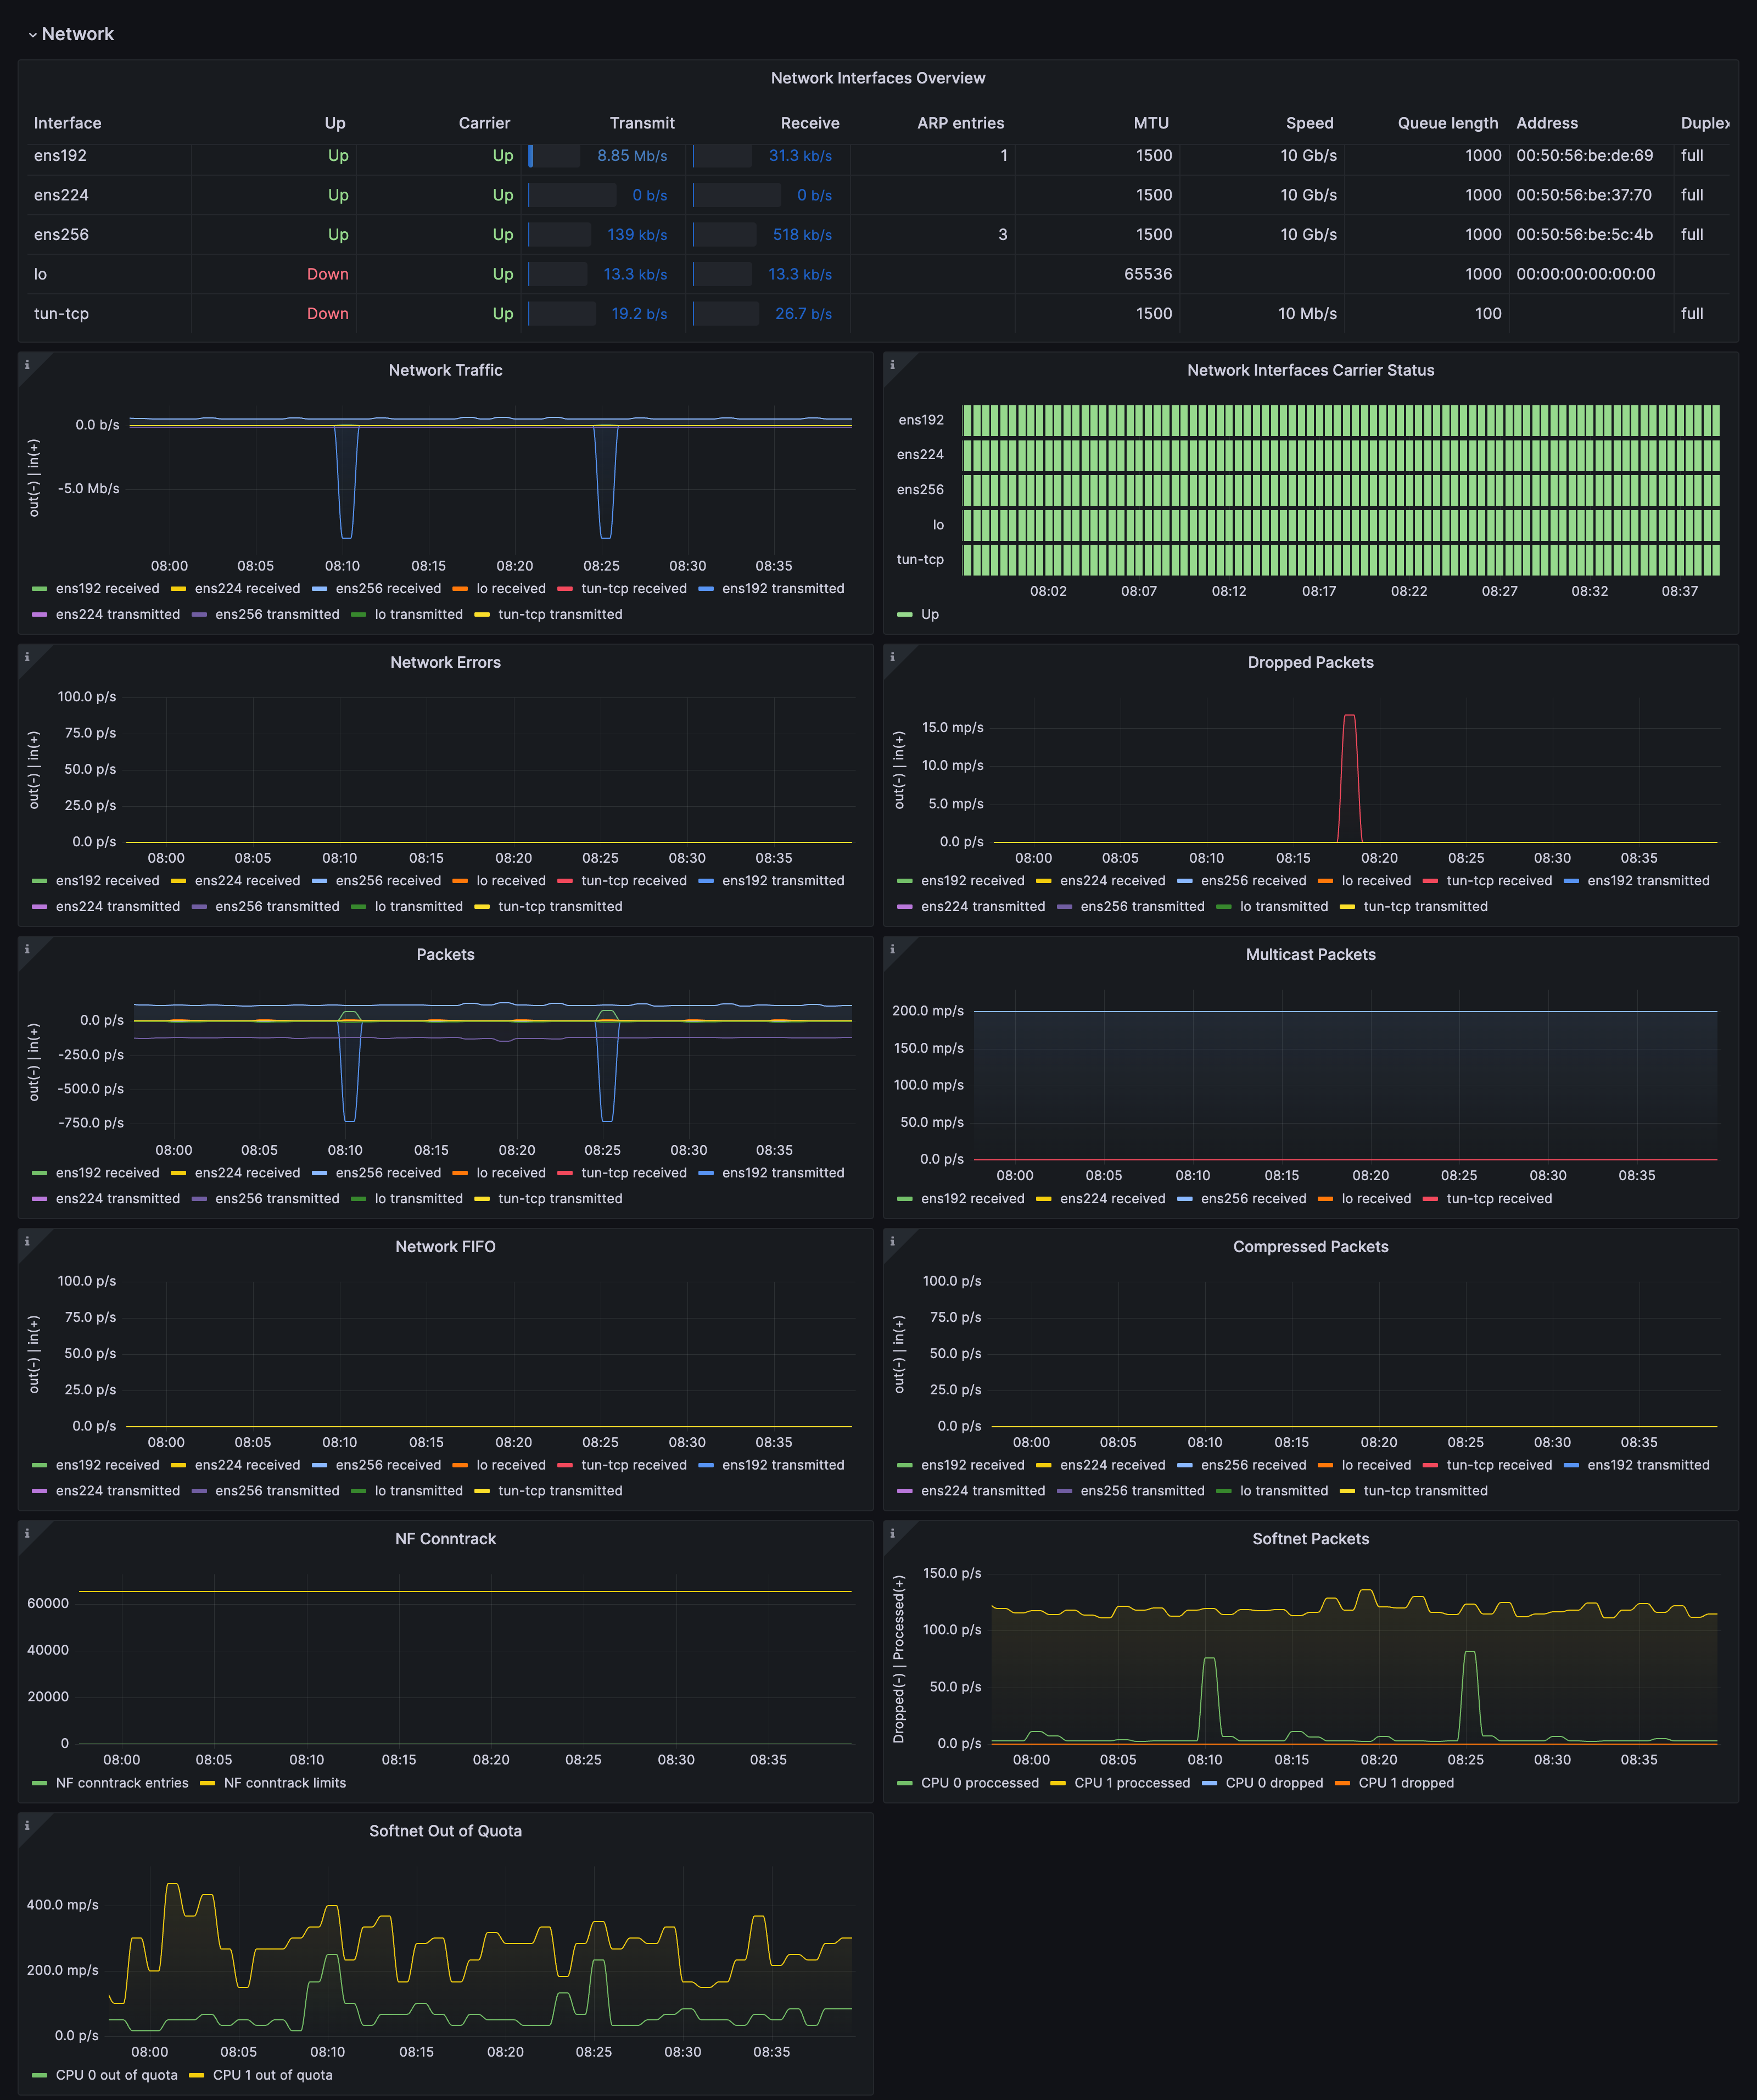
向下钻取仪表盘:网络接口
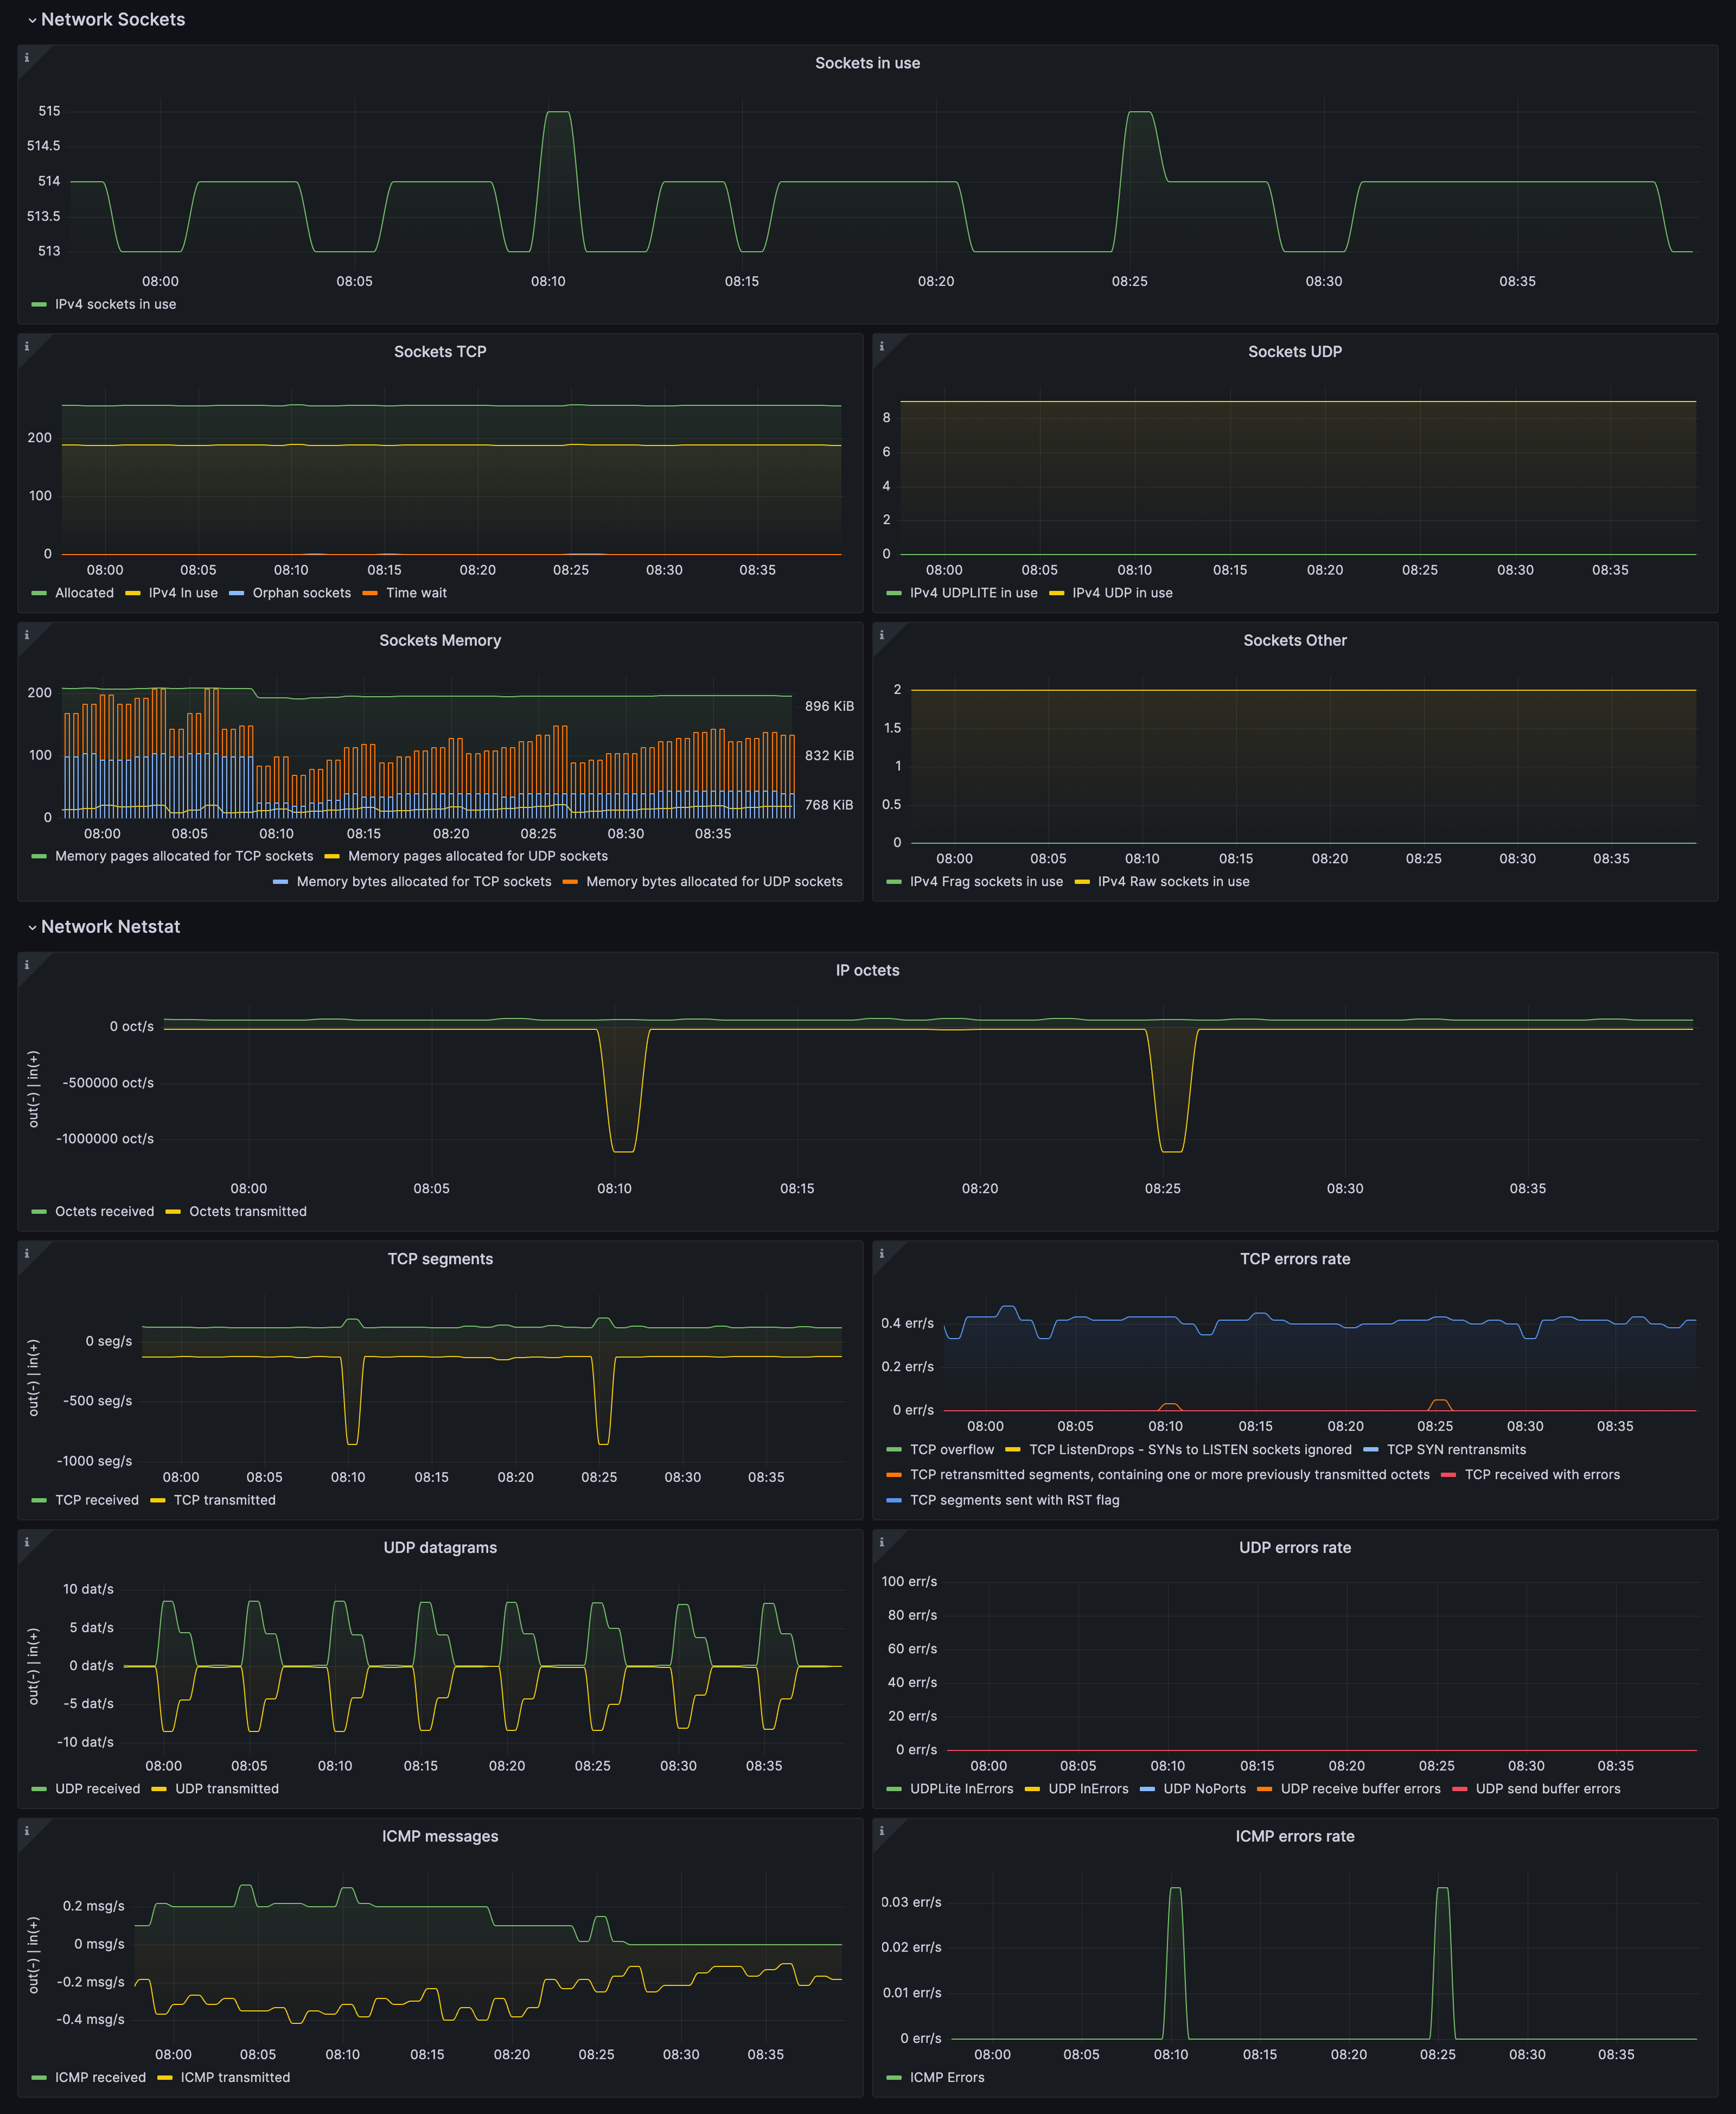
向下钻取仪表盘:套接字统计
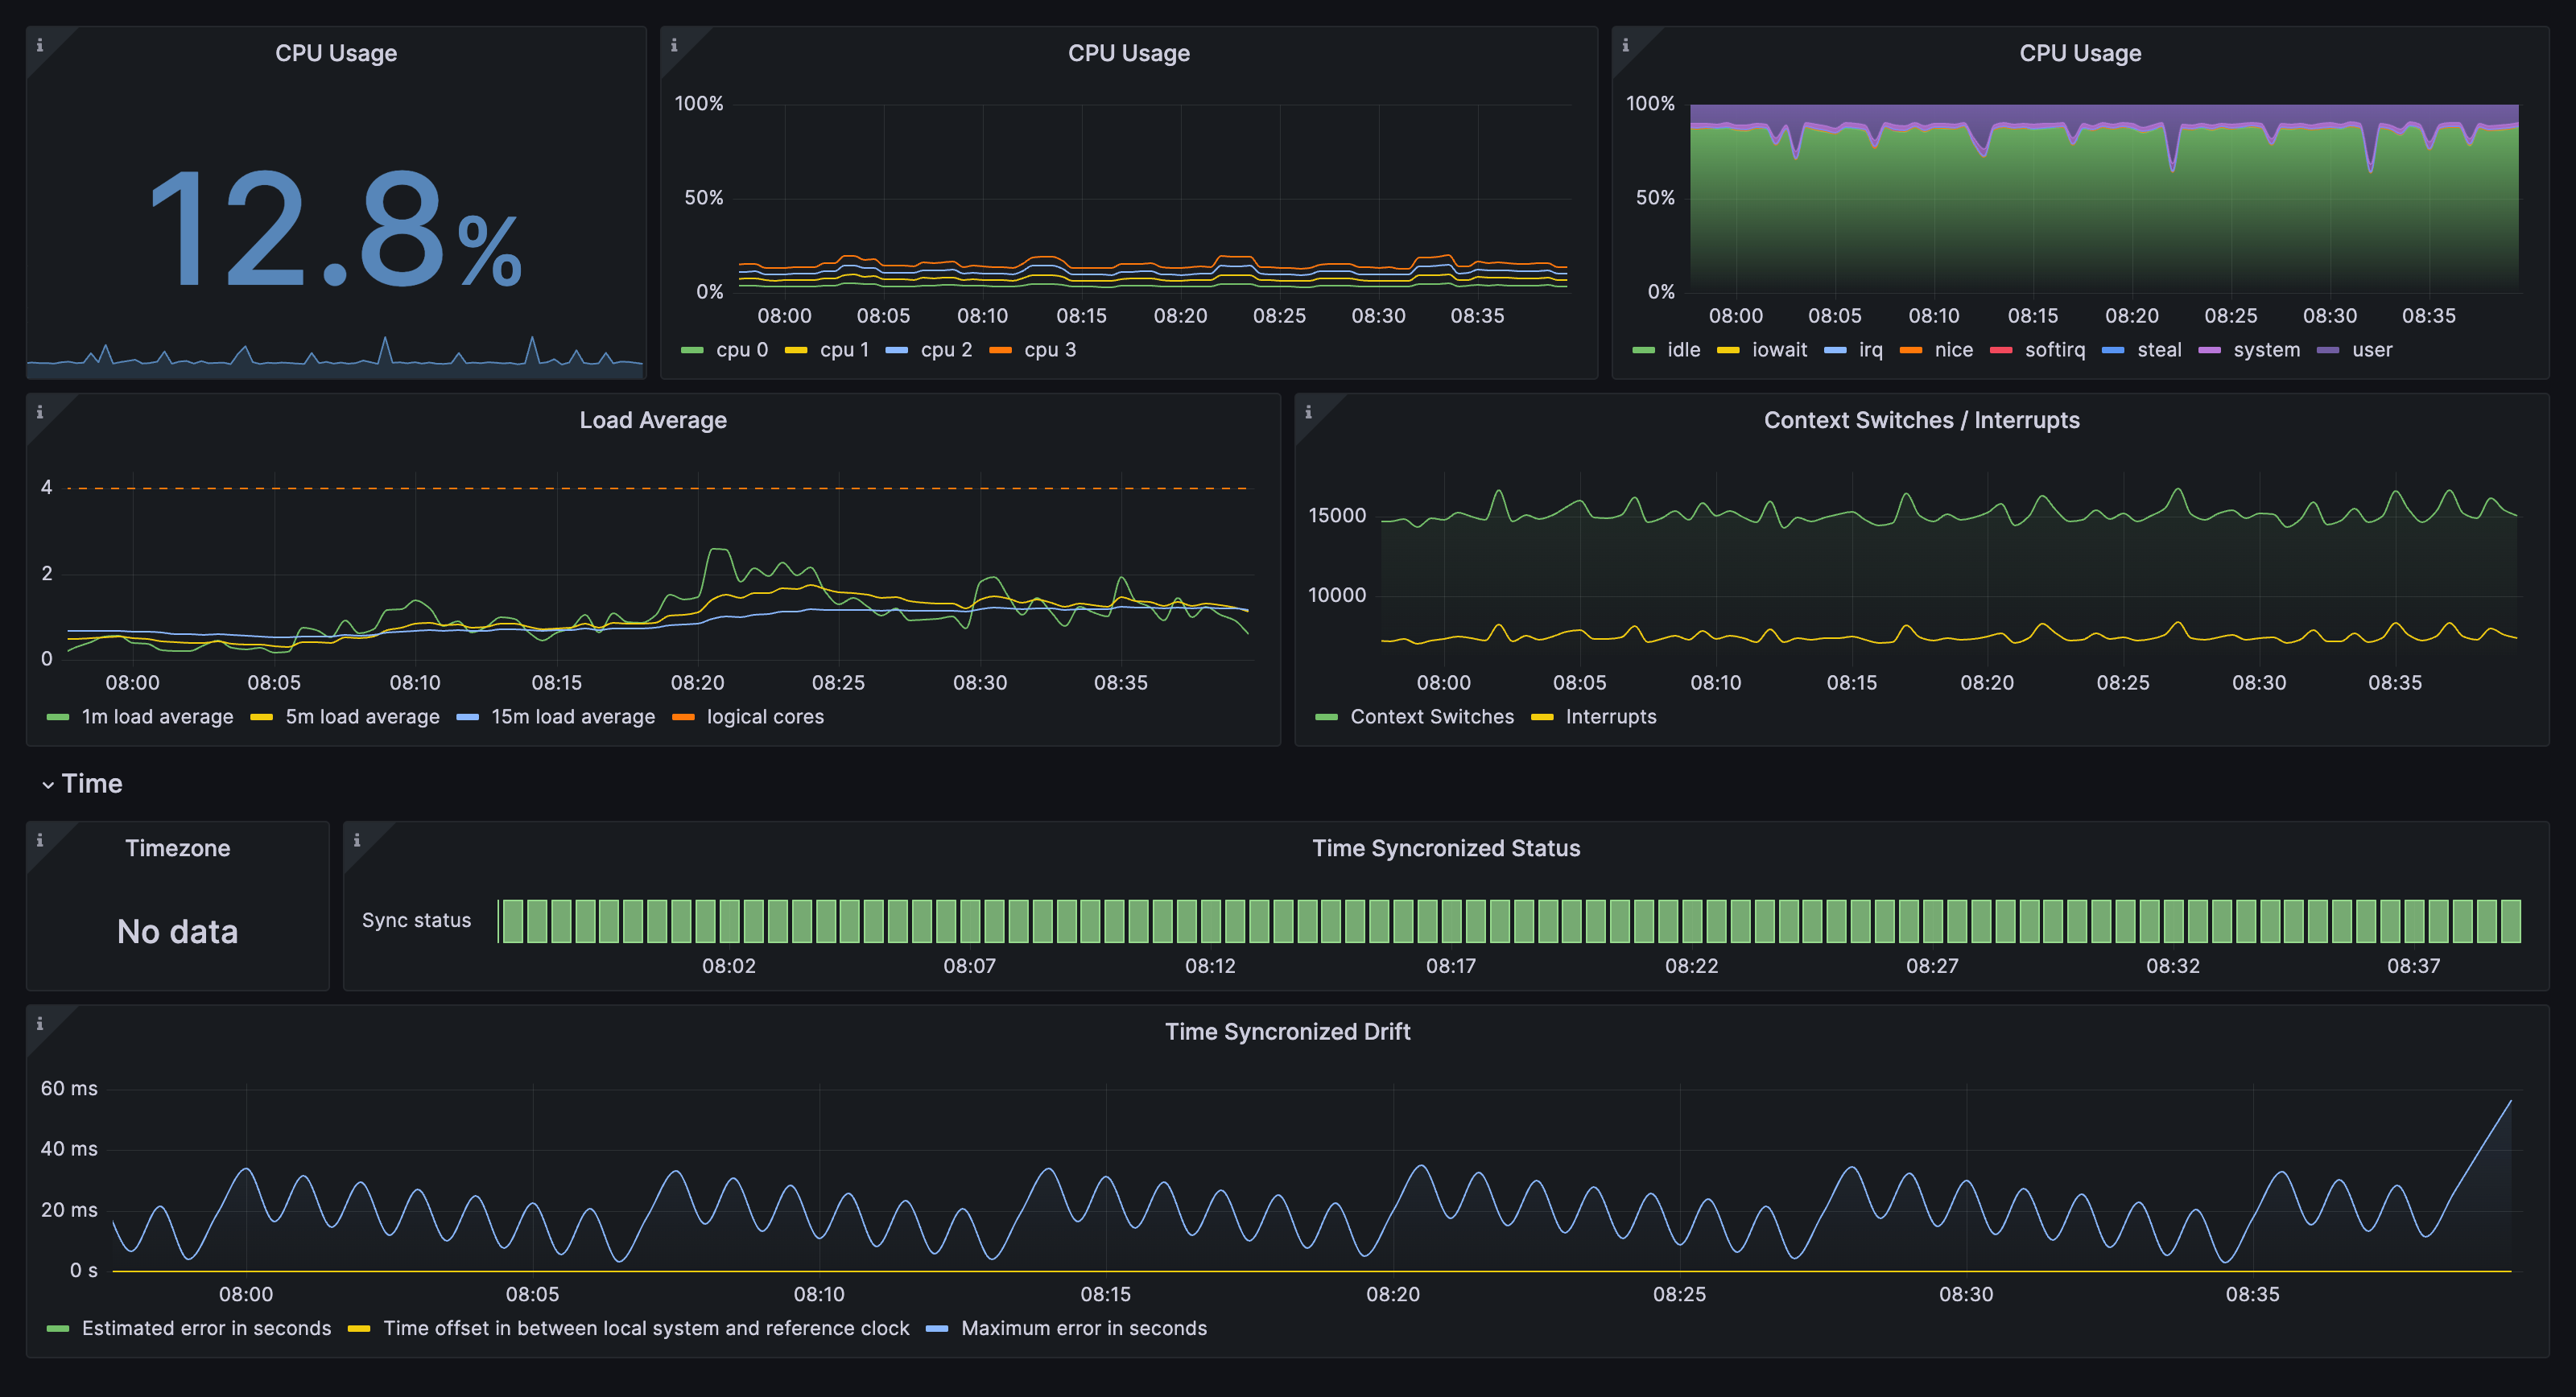
向下钻取仪表盘:CPU 和系统
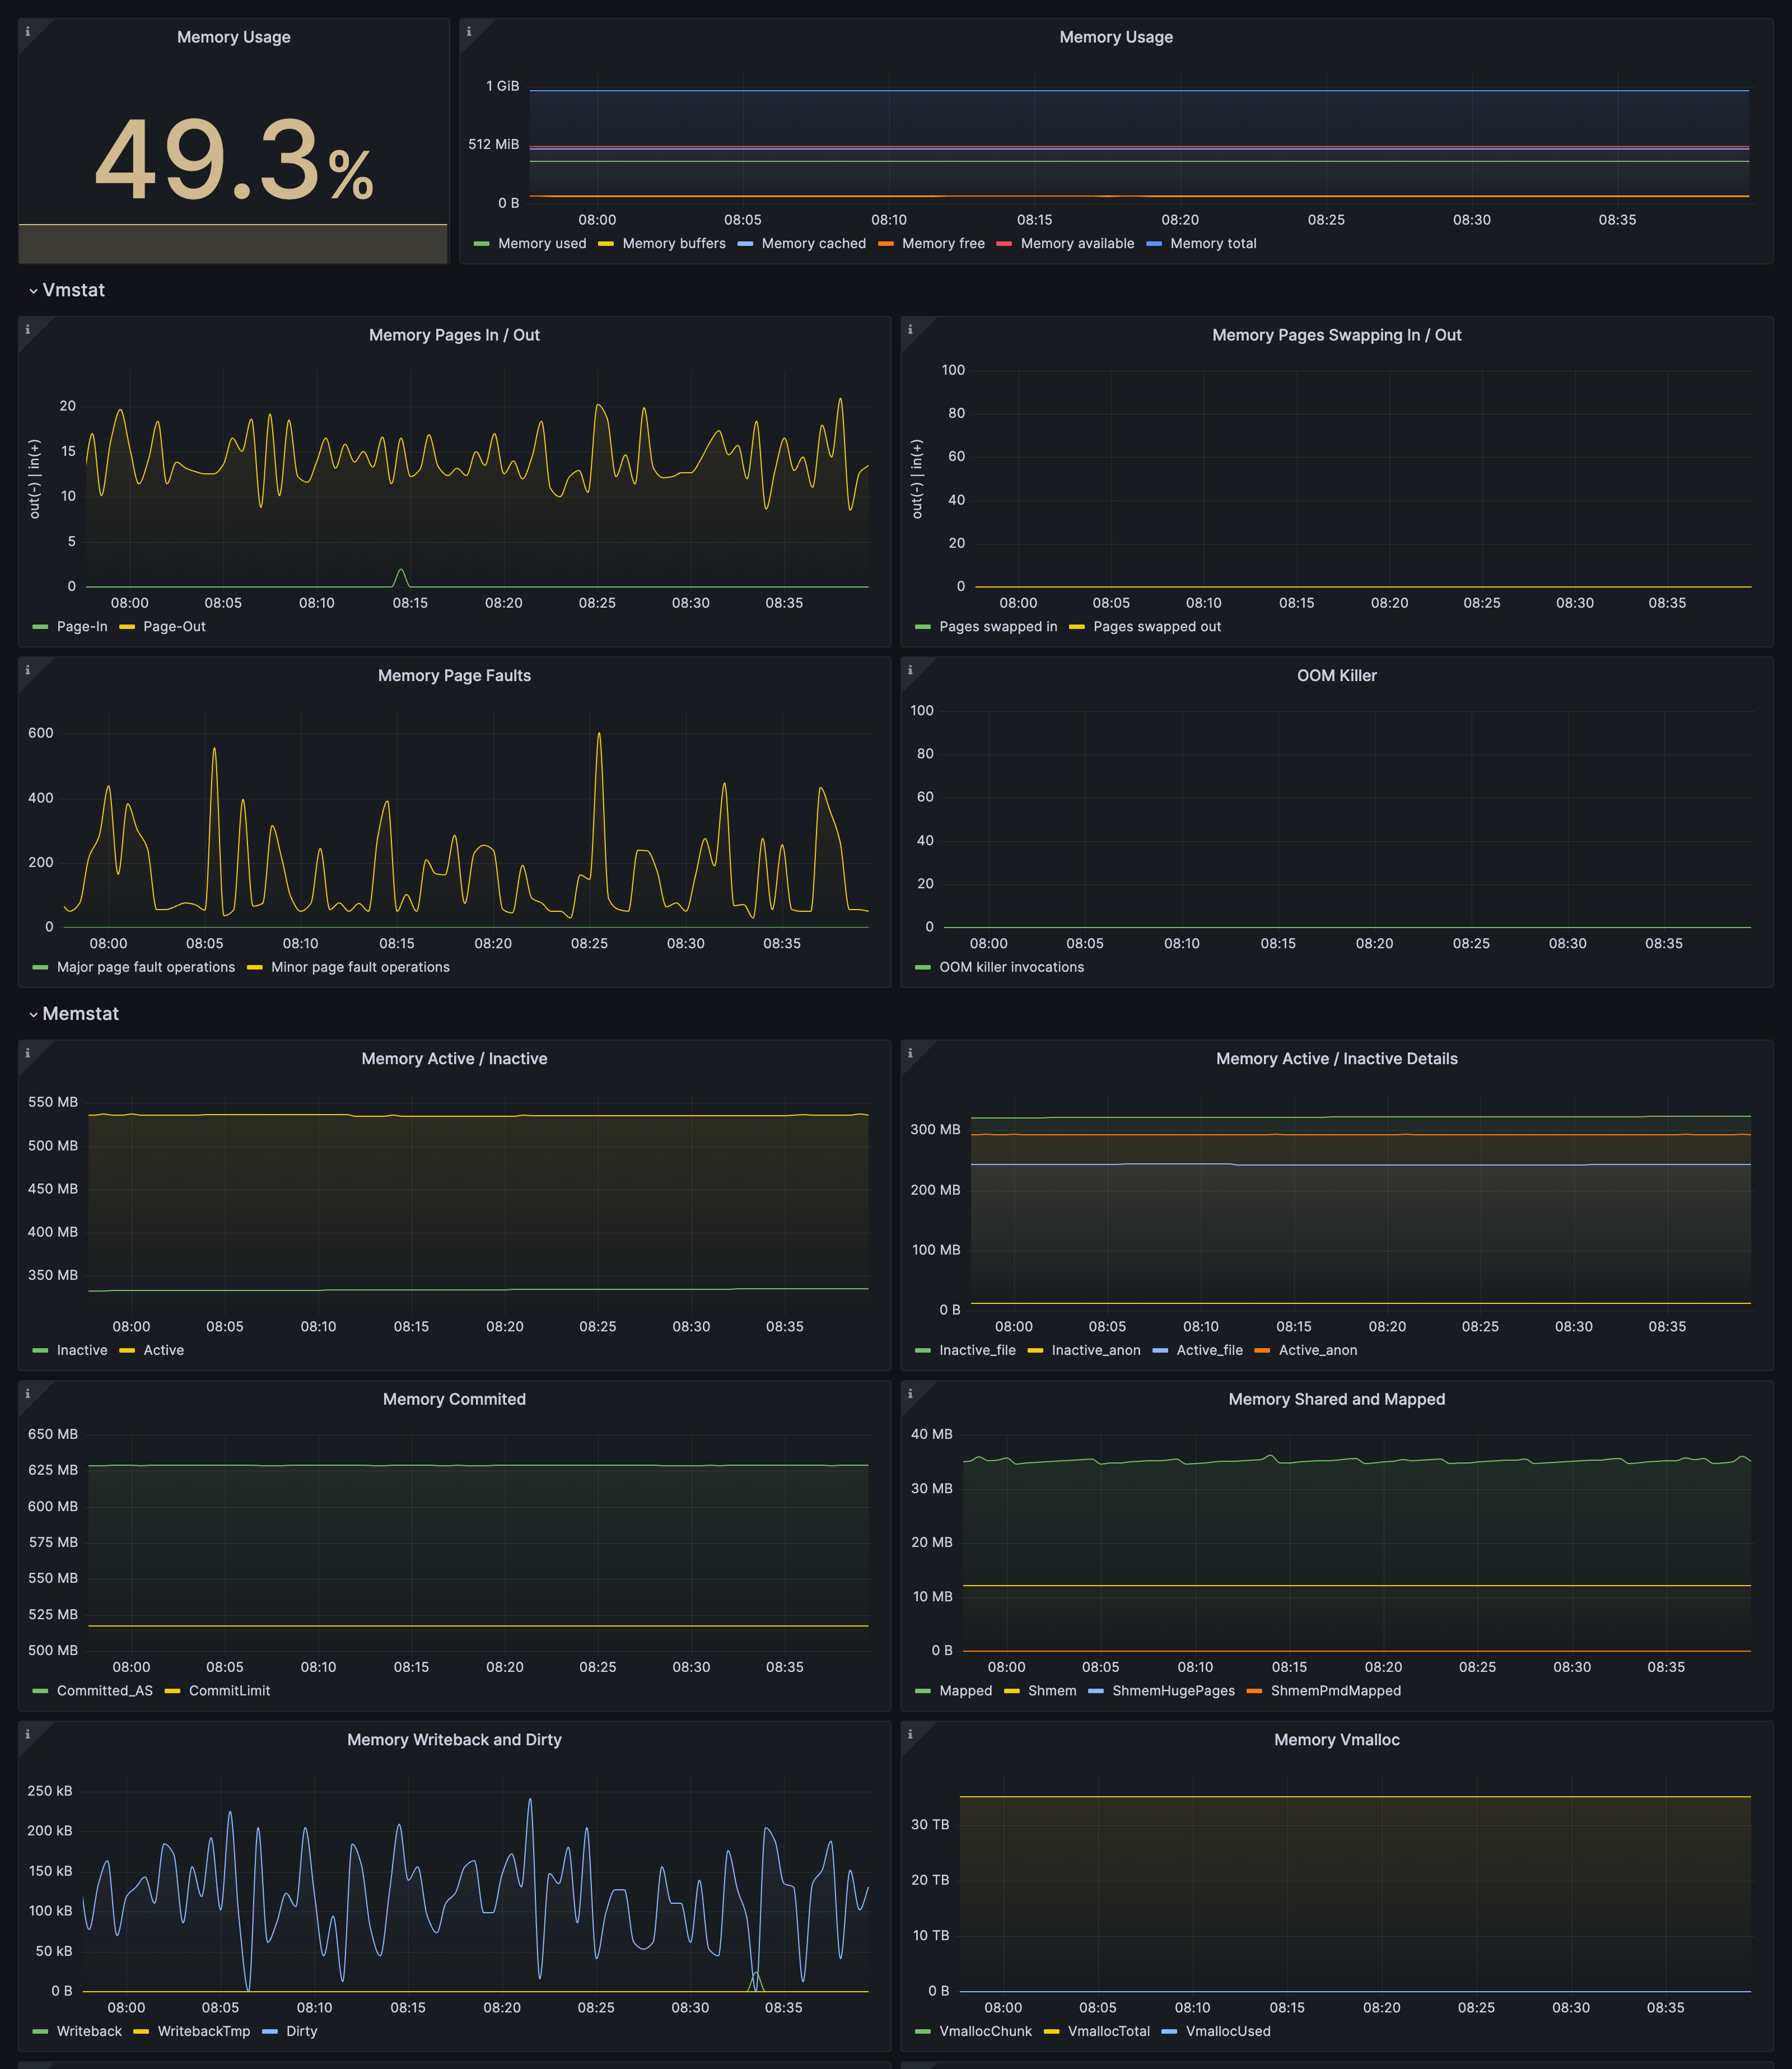
向下钻取仪表盘:内存
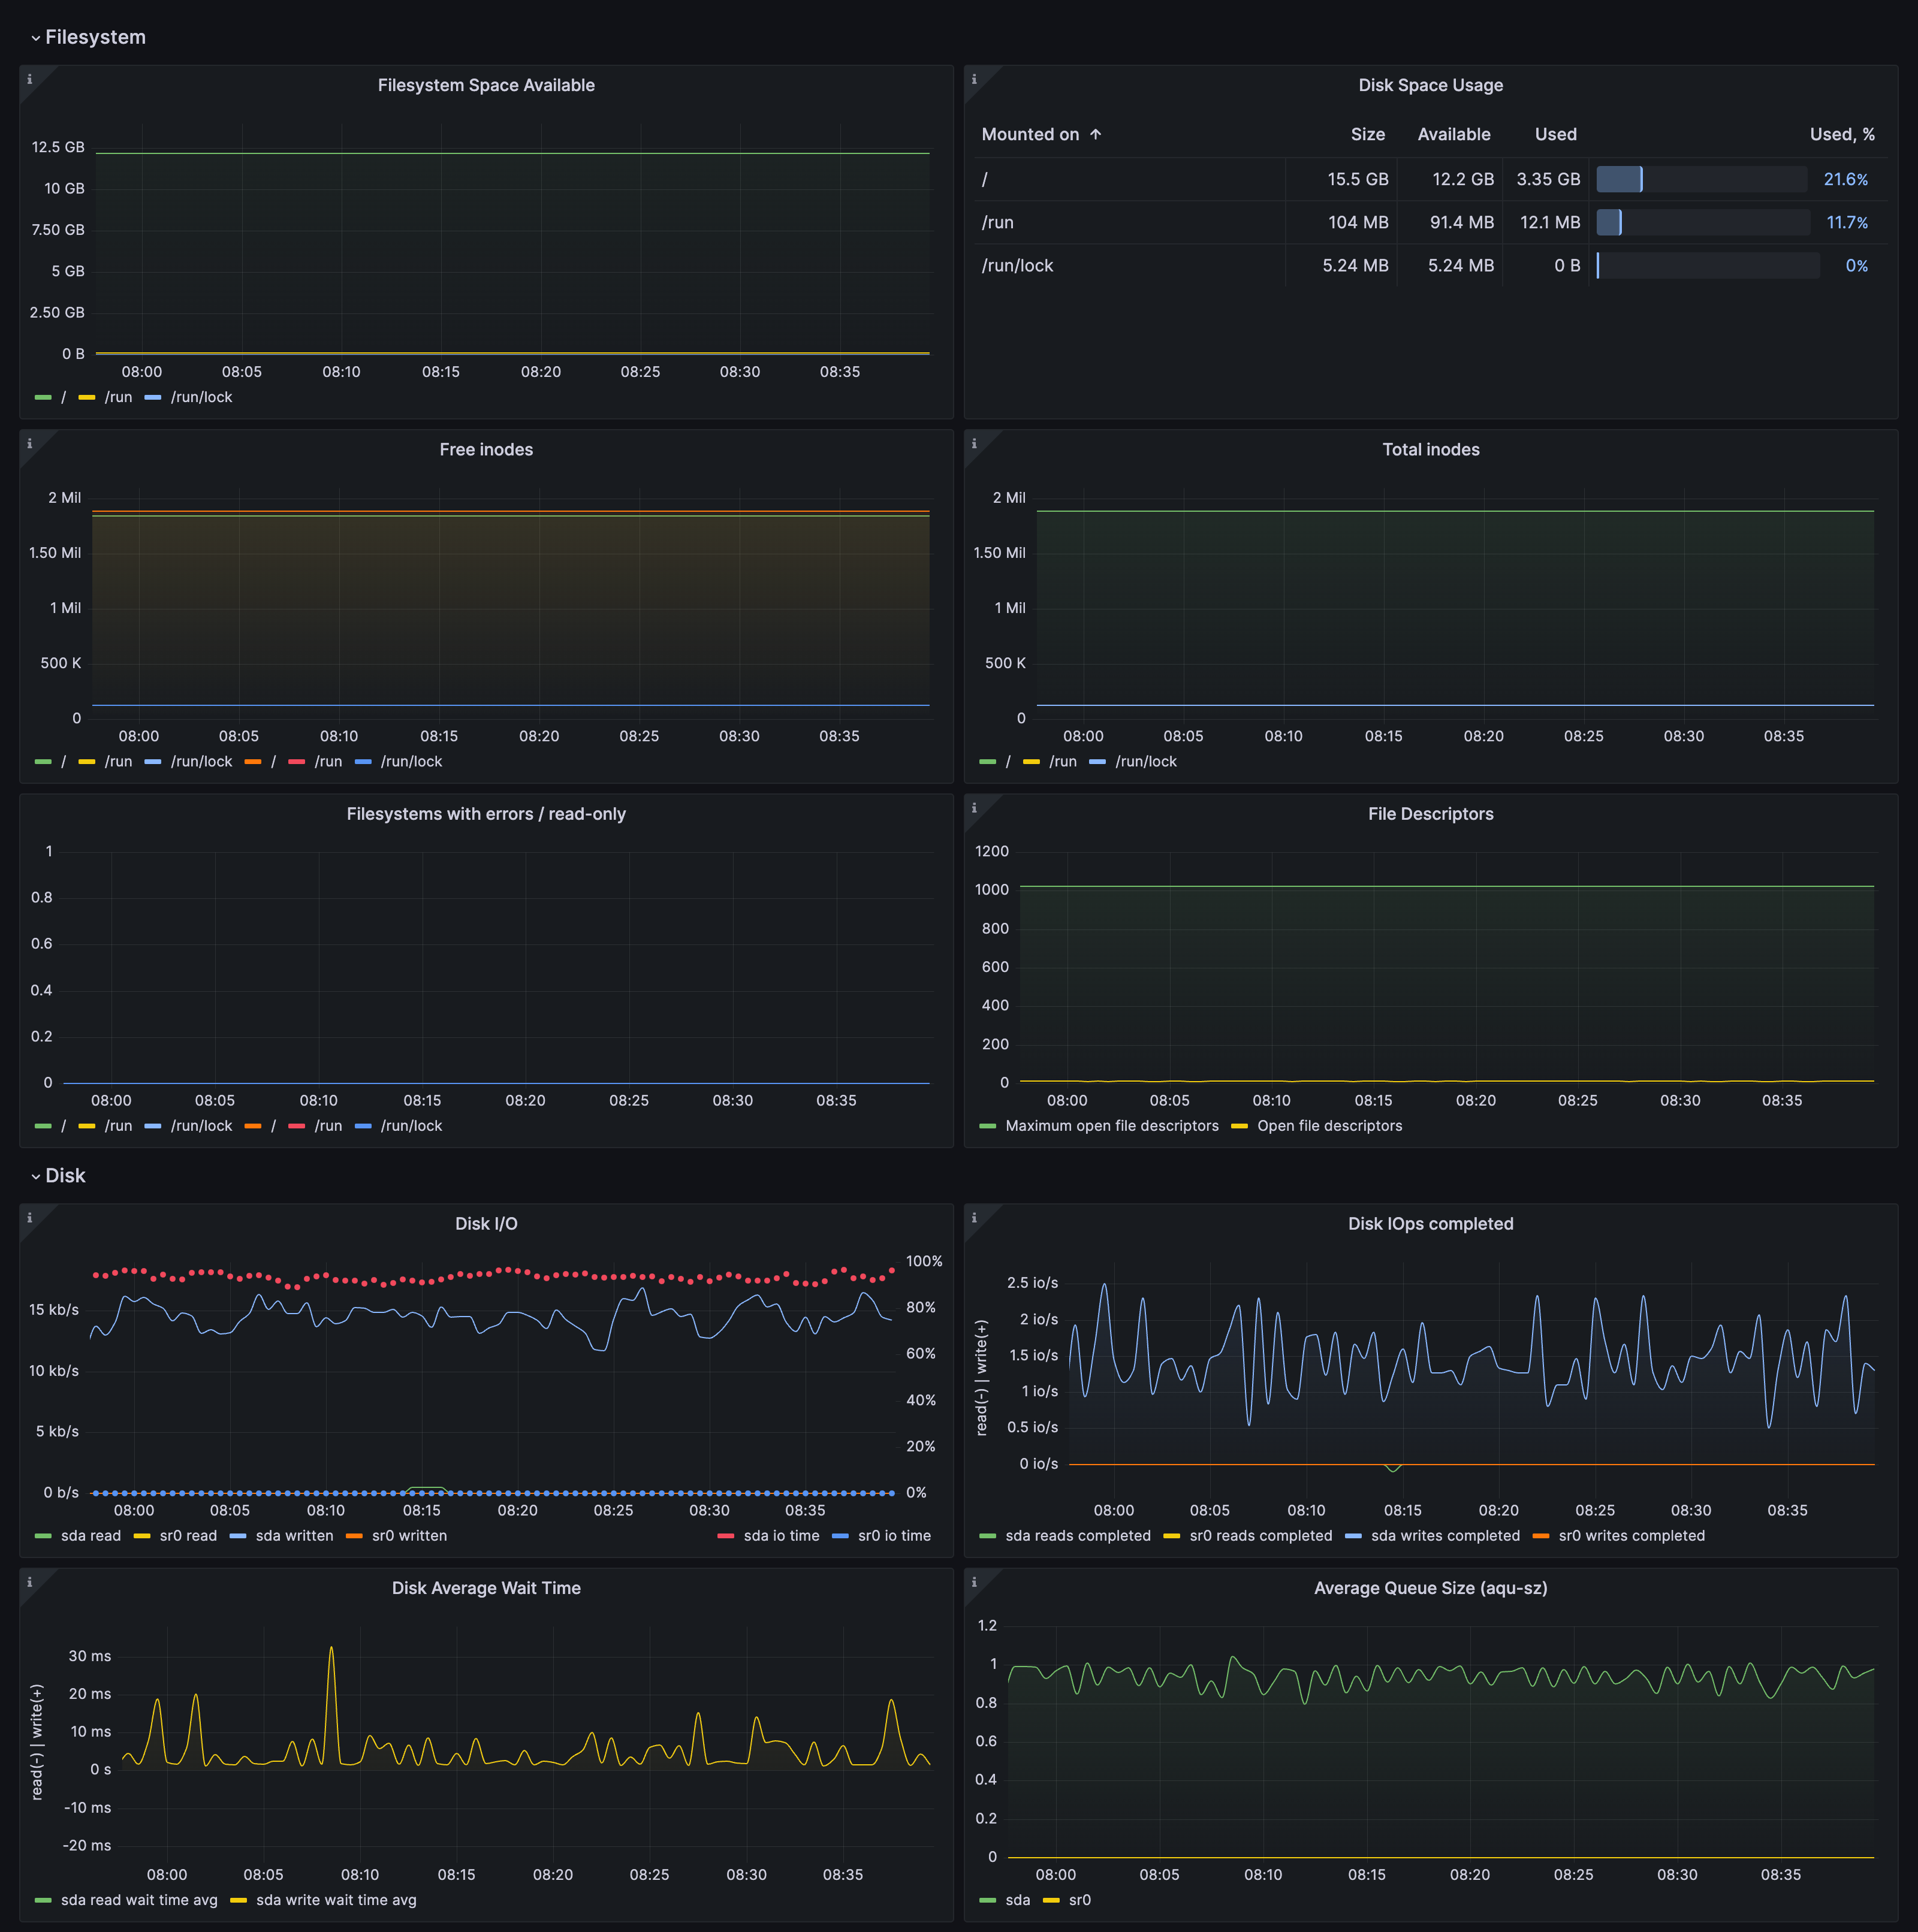
向下钻取仪表盘:磁盘和文件系统
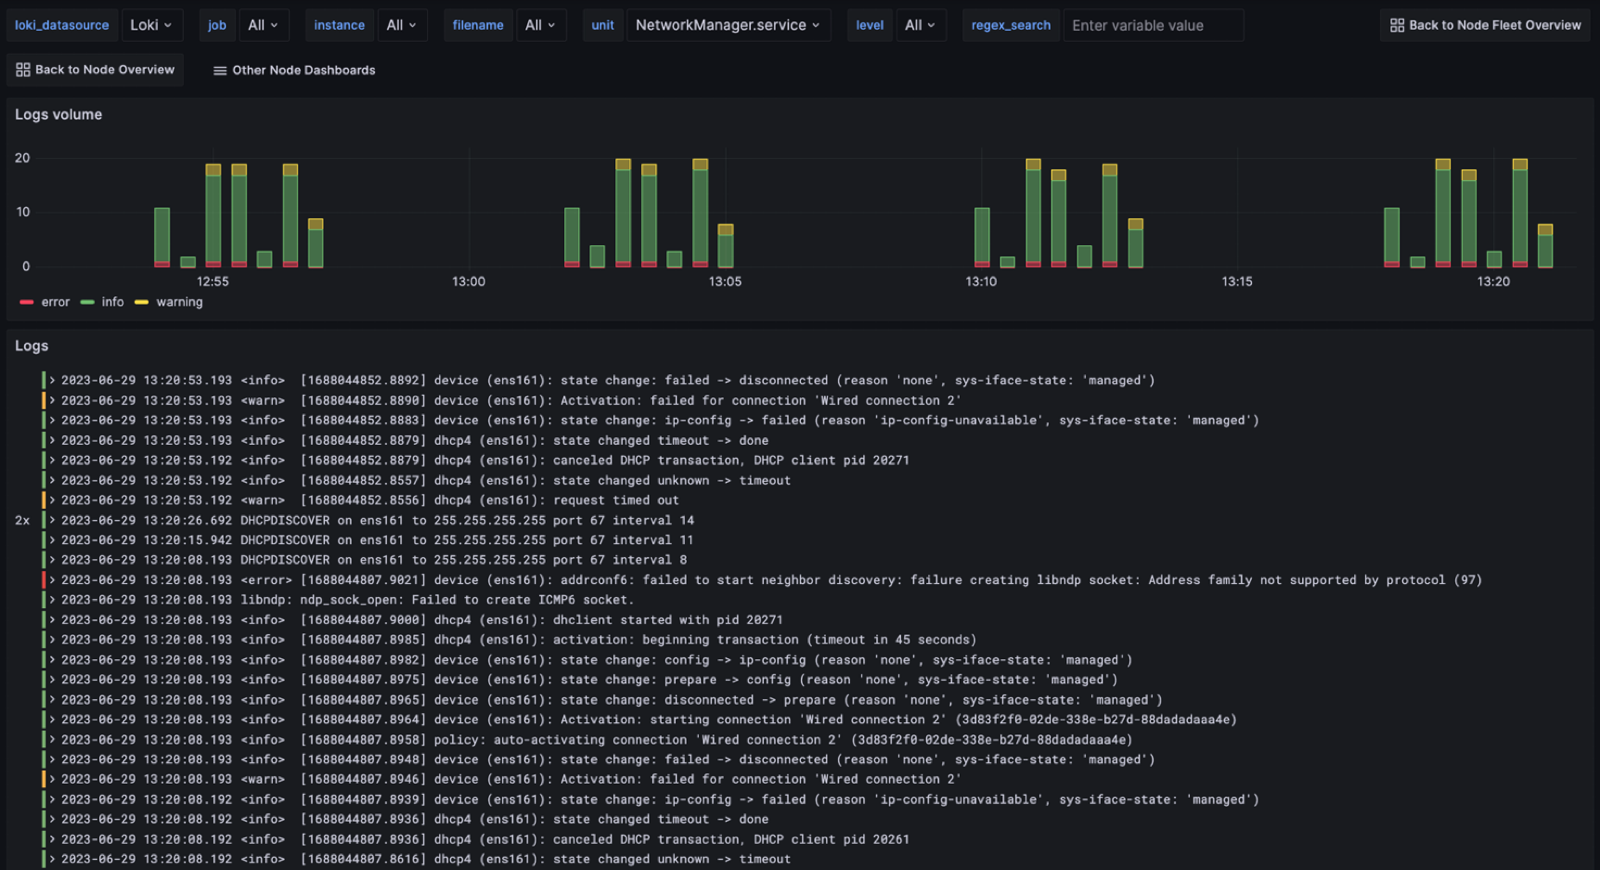
向下钻取仪表盘:日志
端到端解决方案
精选解决方案,助您更轻松快捷地实现目标
监控基础设施
开箱即用的 KPI、仪表盘和可观测性告警
可视化任何数据
即时连接所有数据源到 Grafana
即时连接所有数据源到 Grafana
使用 Grafana Cloud 开箱即用的监控解决方案轻松监控您的 Linux 操作系统部署。Grafana Cloud 永久免费套餐包含 3 个用户和多达 1 万个指标时序,以满足您的监控需求。