
使用 Grafana 轻松监控 InfluxDB
使用 Grafana Cloud 开箱即用的监控解决方案,轻松监控您的 InfluxDB 部署,InfluxDB 是一种开源时序数据库。Grafana Cloud 的永久免费计划包括 3 位用户和高达 1 万系列指标,以支持您的监控需求。
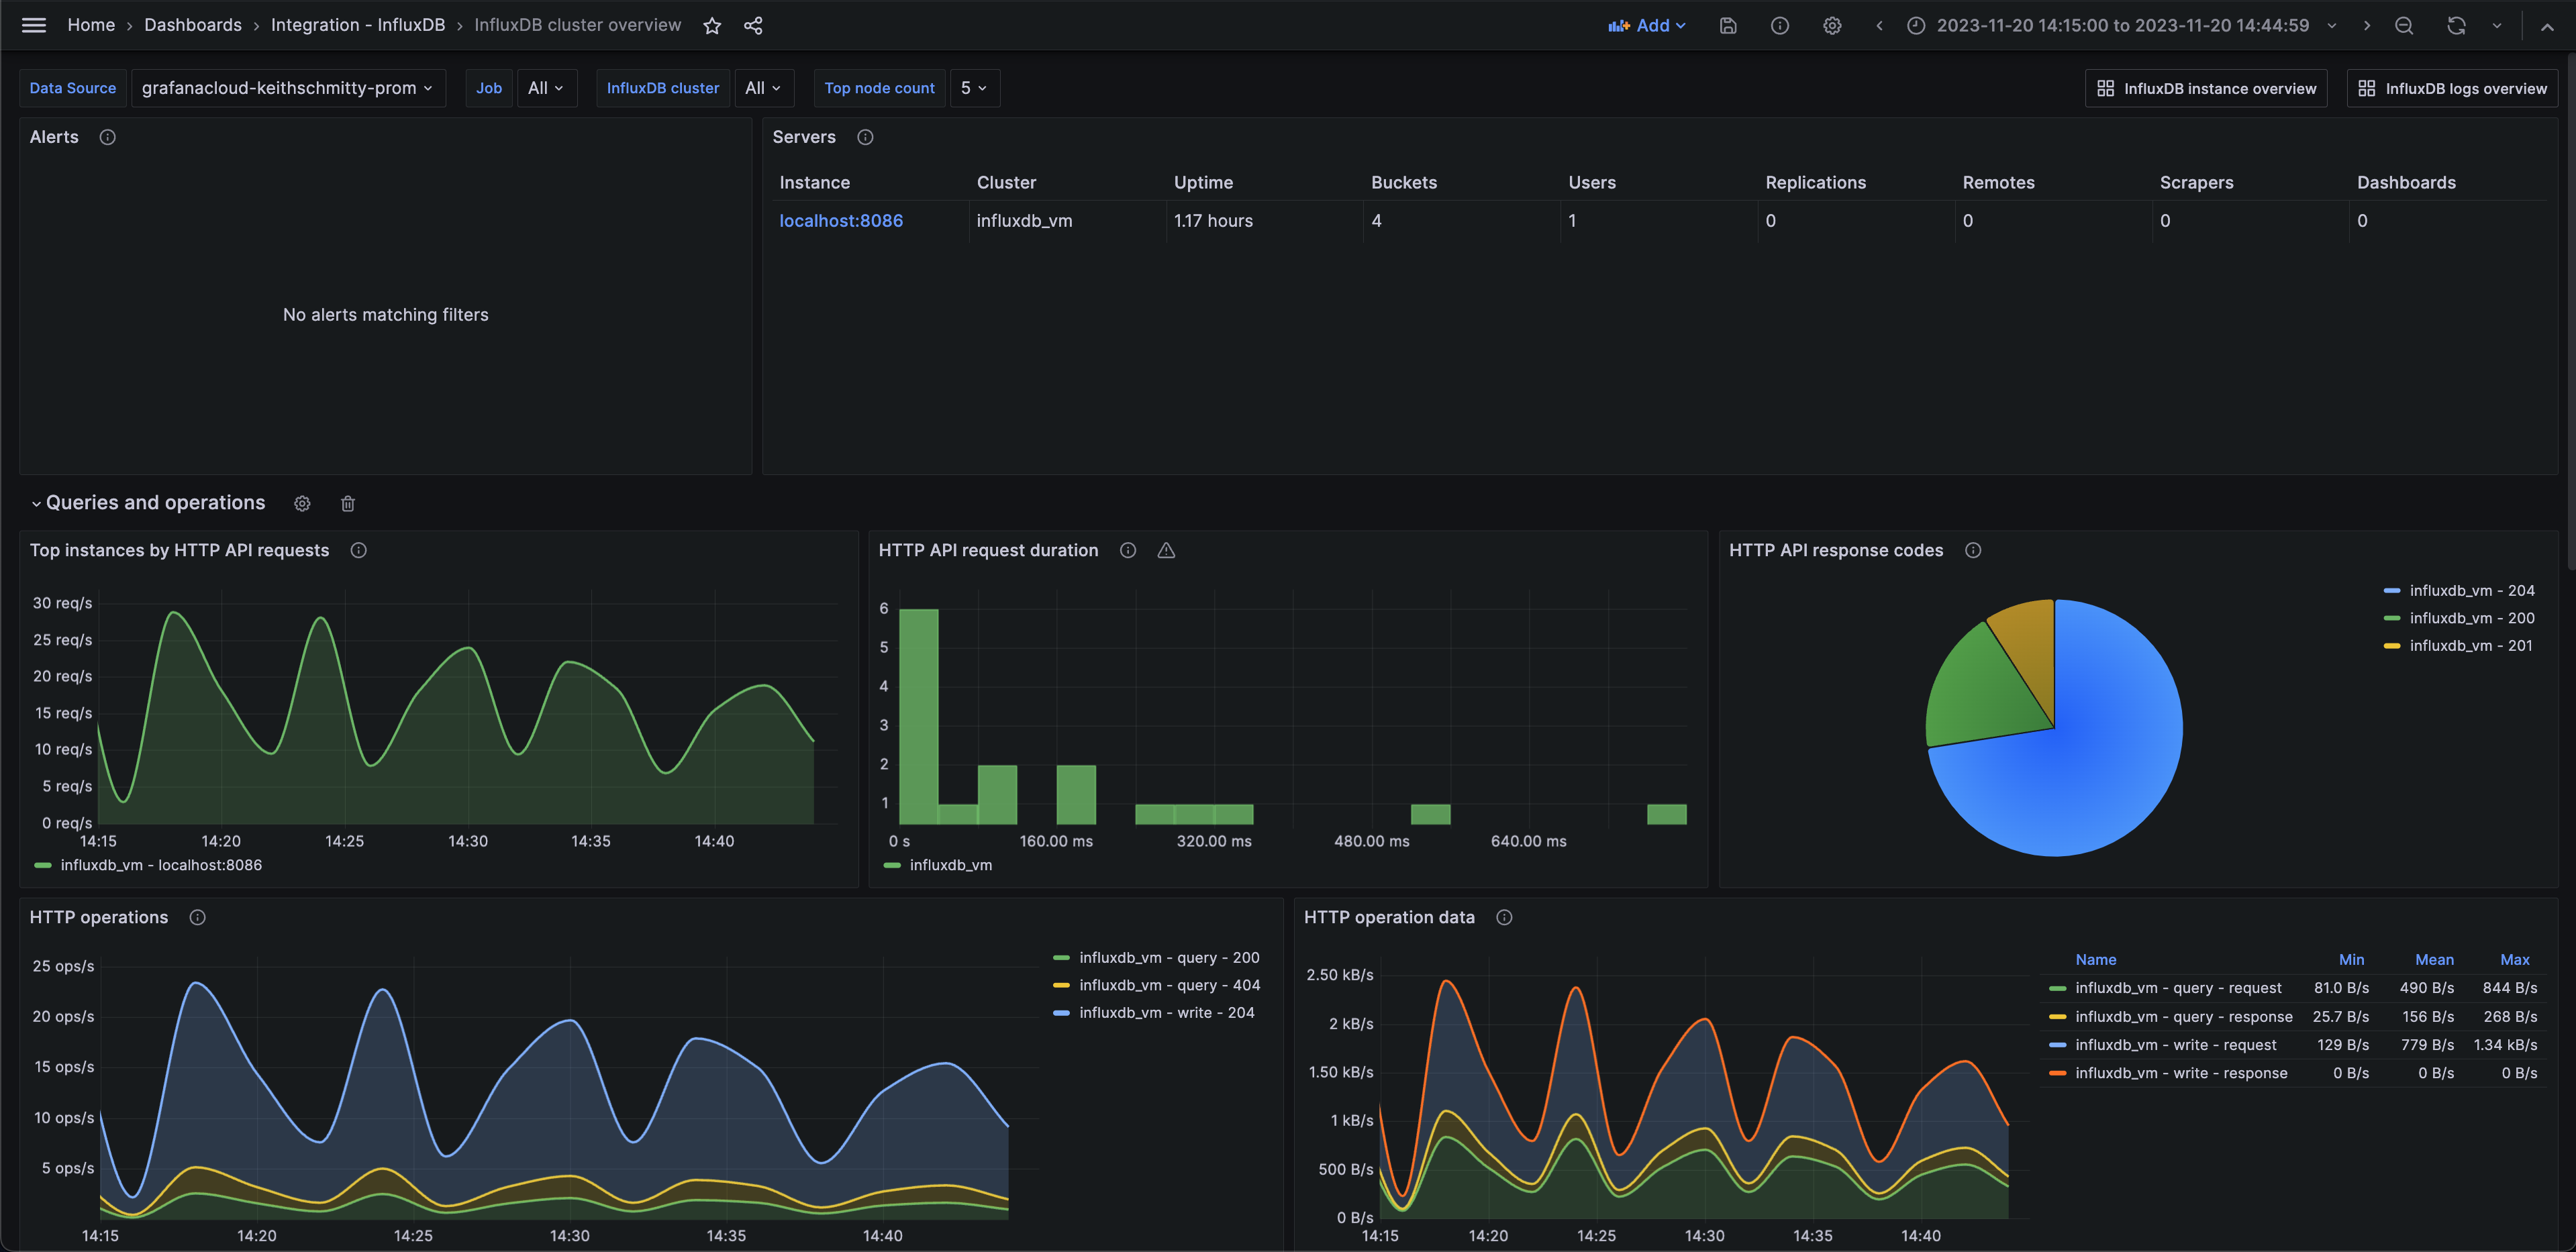
InfluxDB 集群概览(查询)
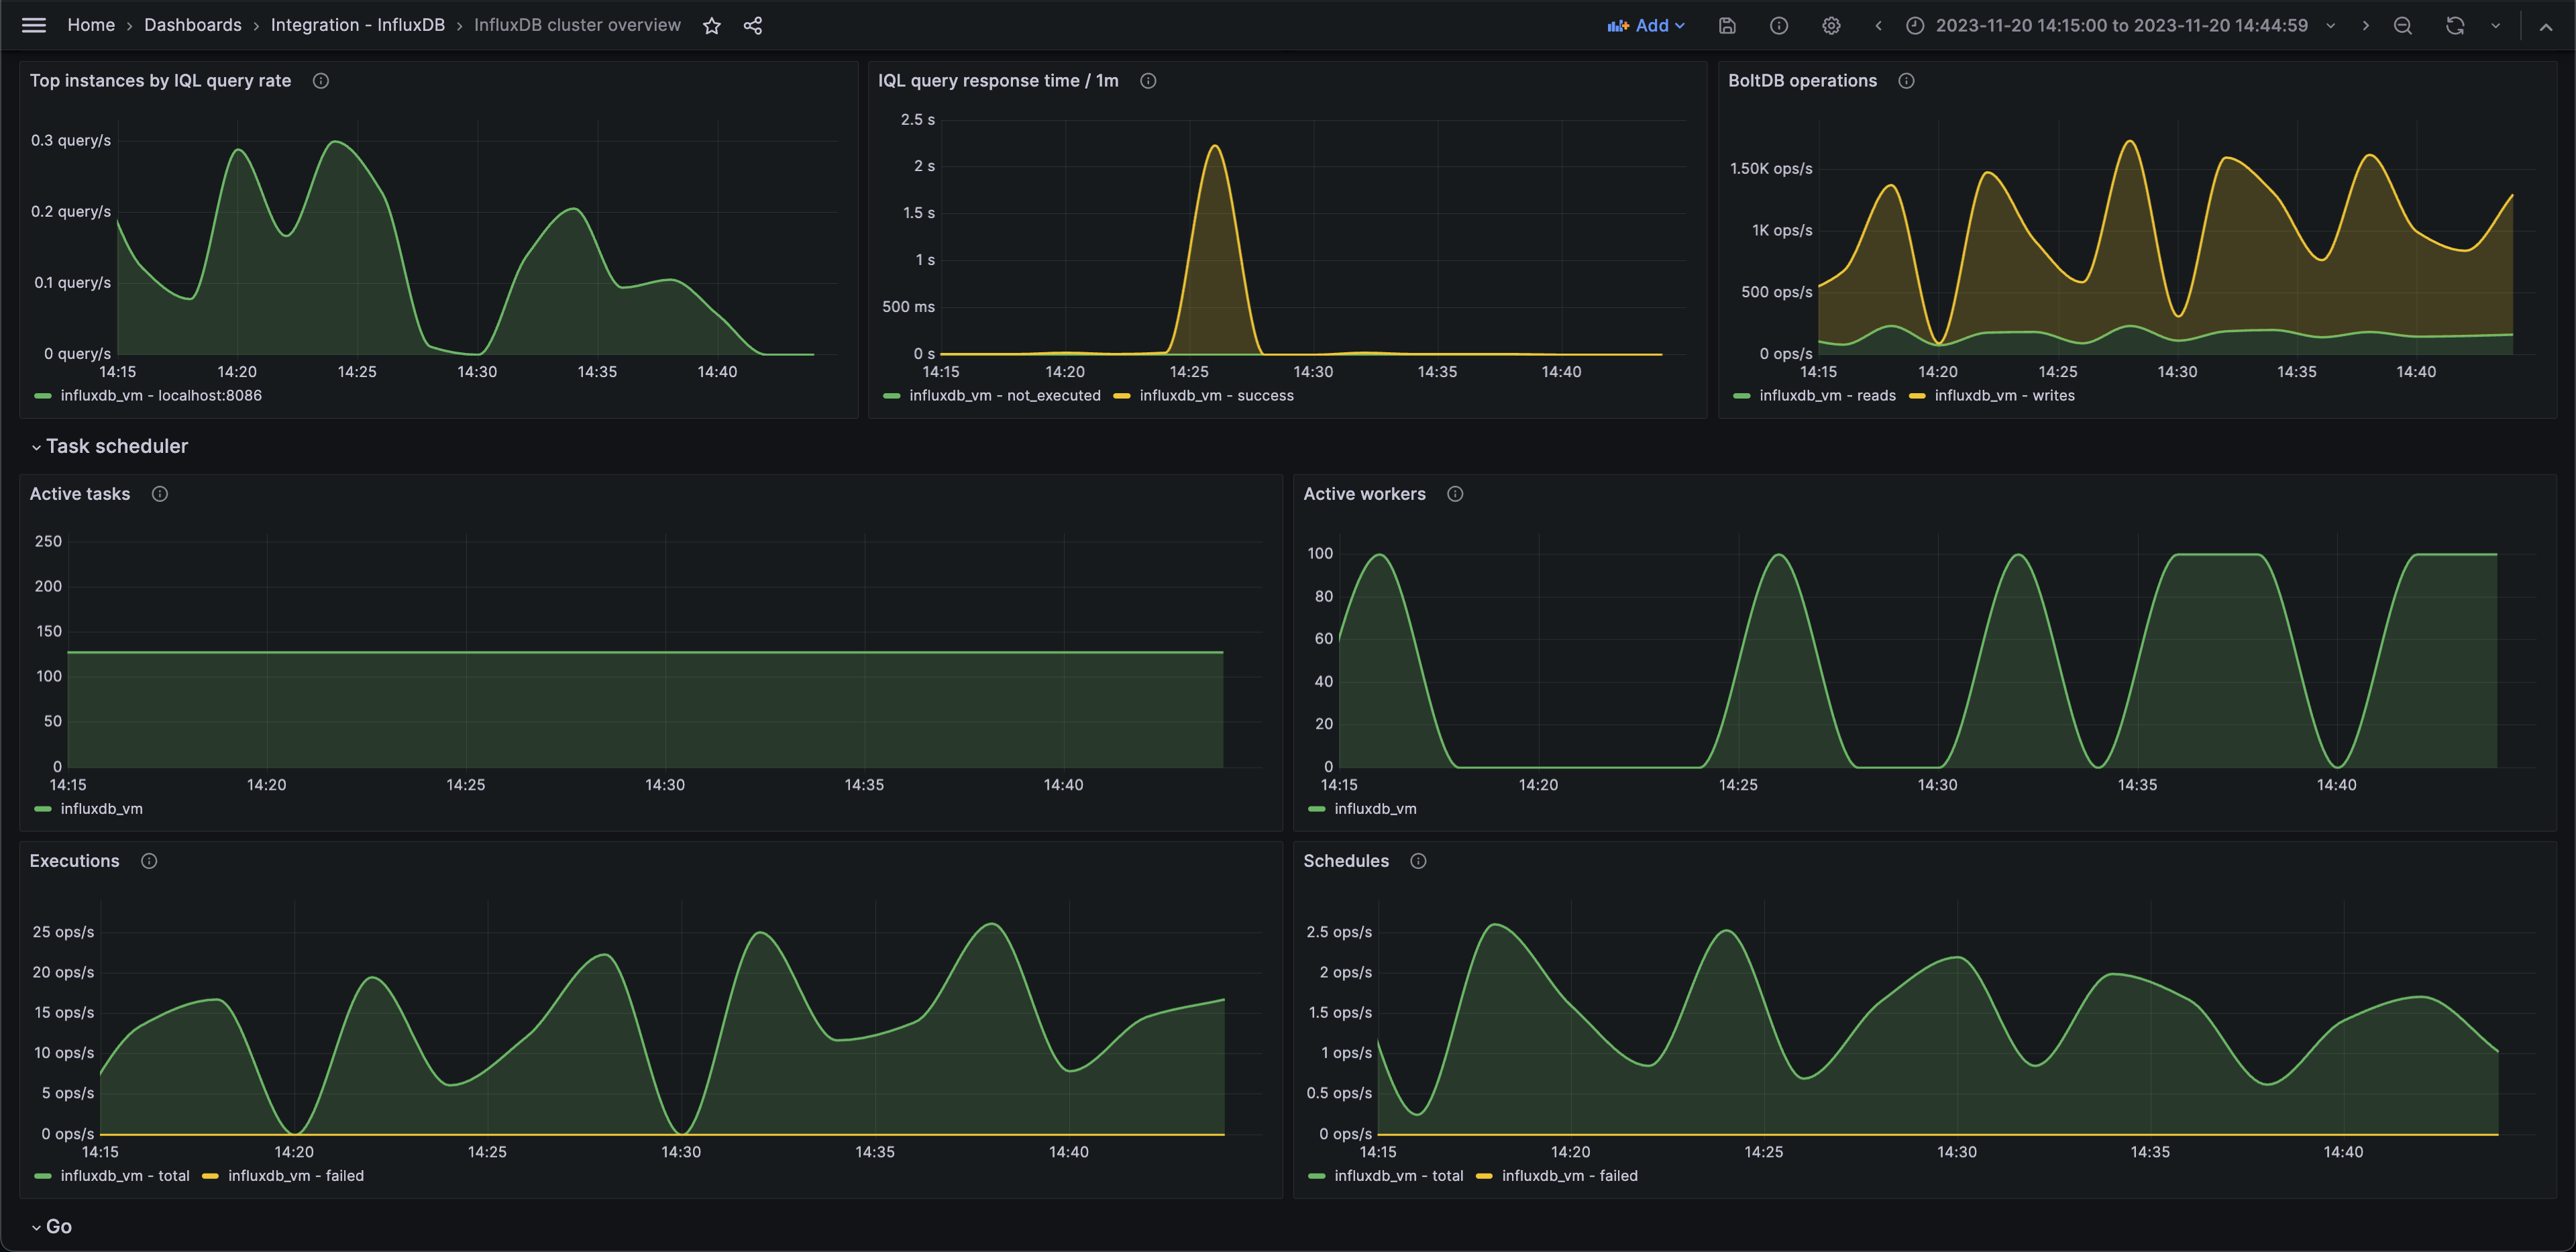
InfluxDB 集群概览(任务)
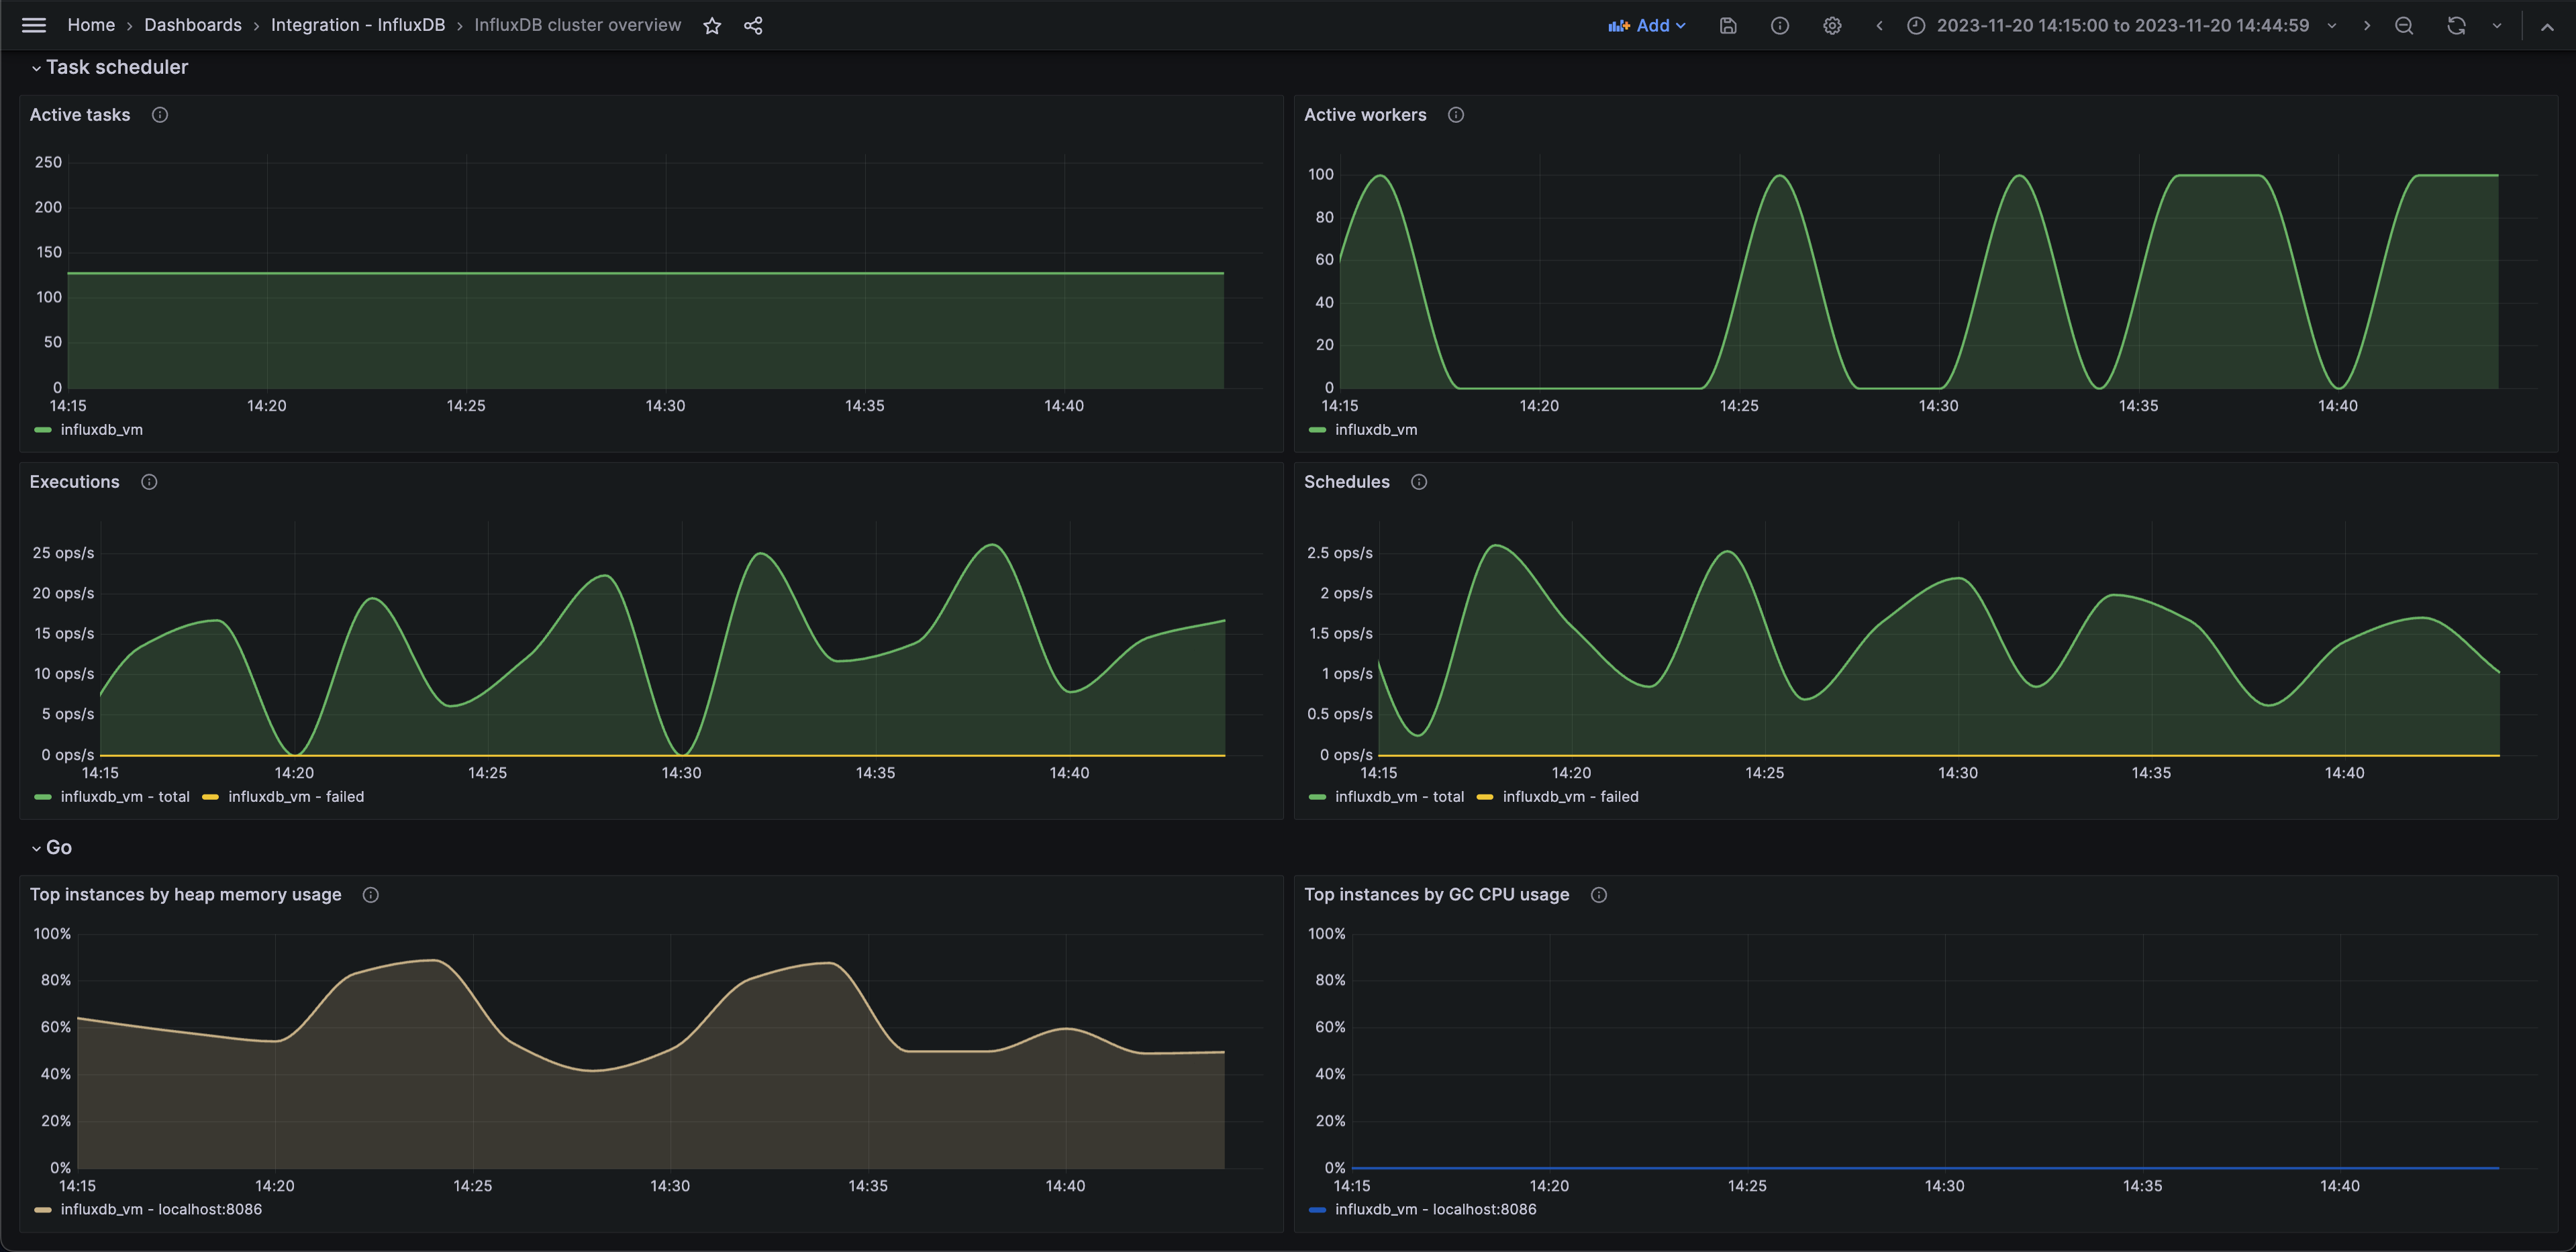
InfluxDB 集群概览(Go)
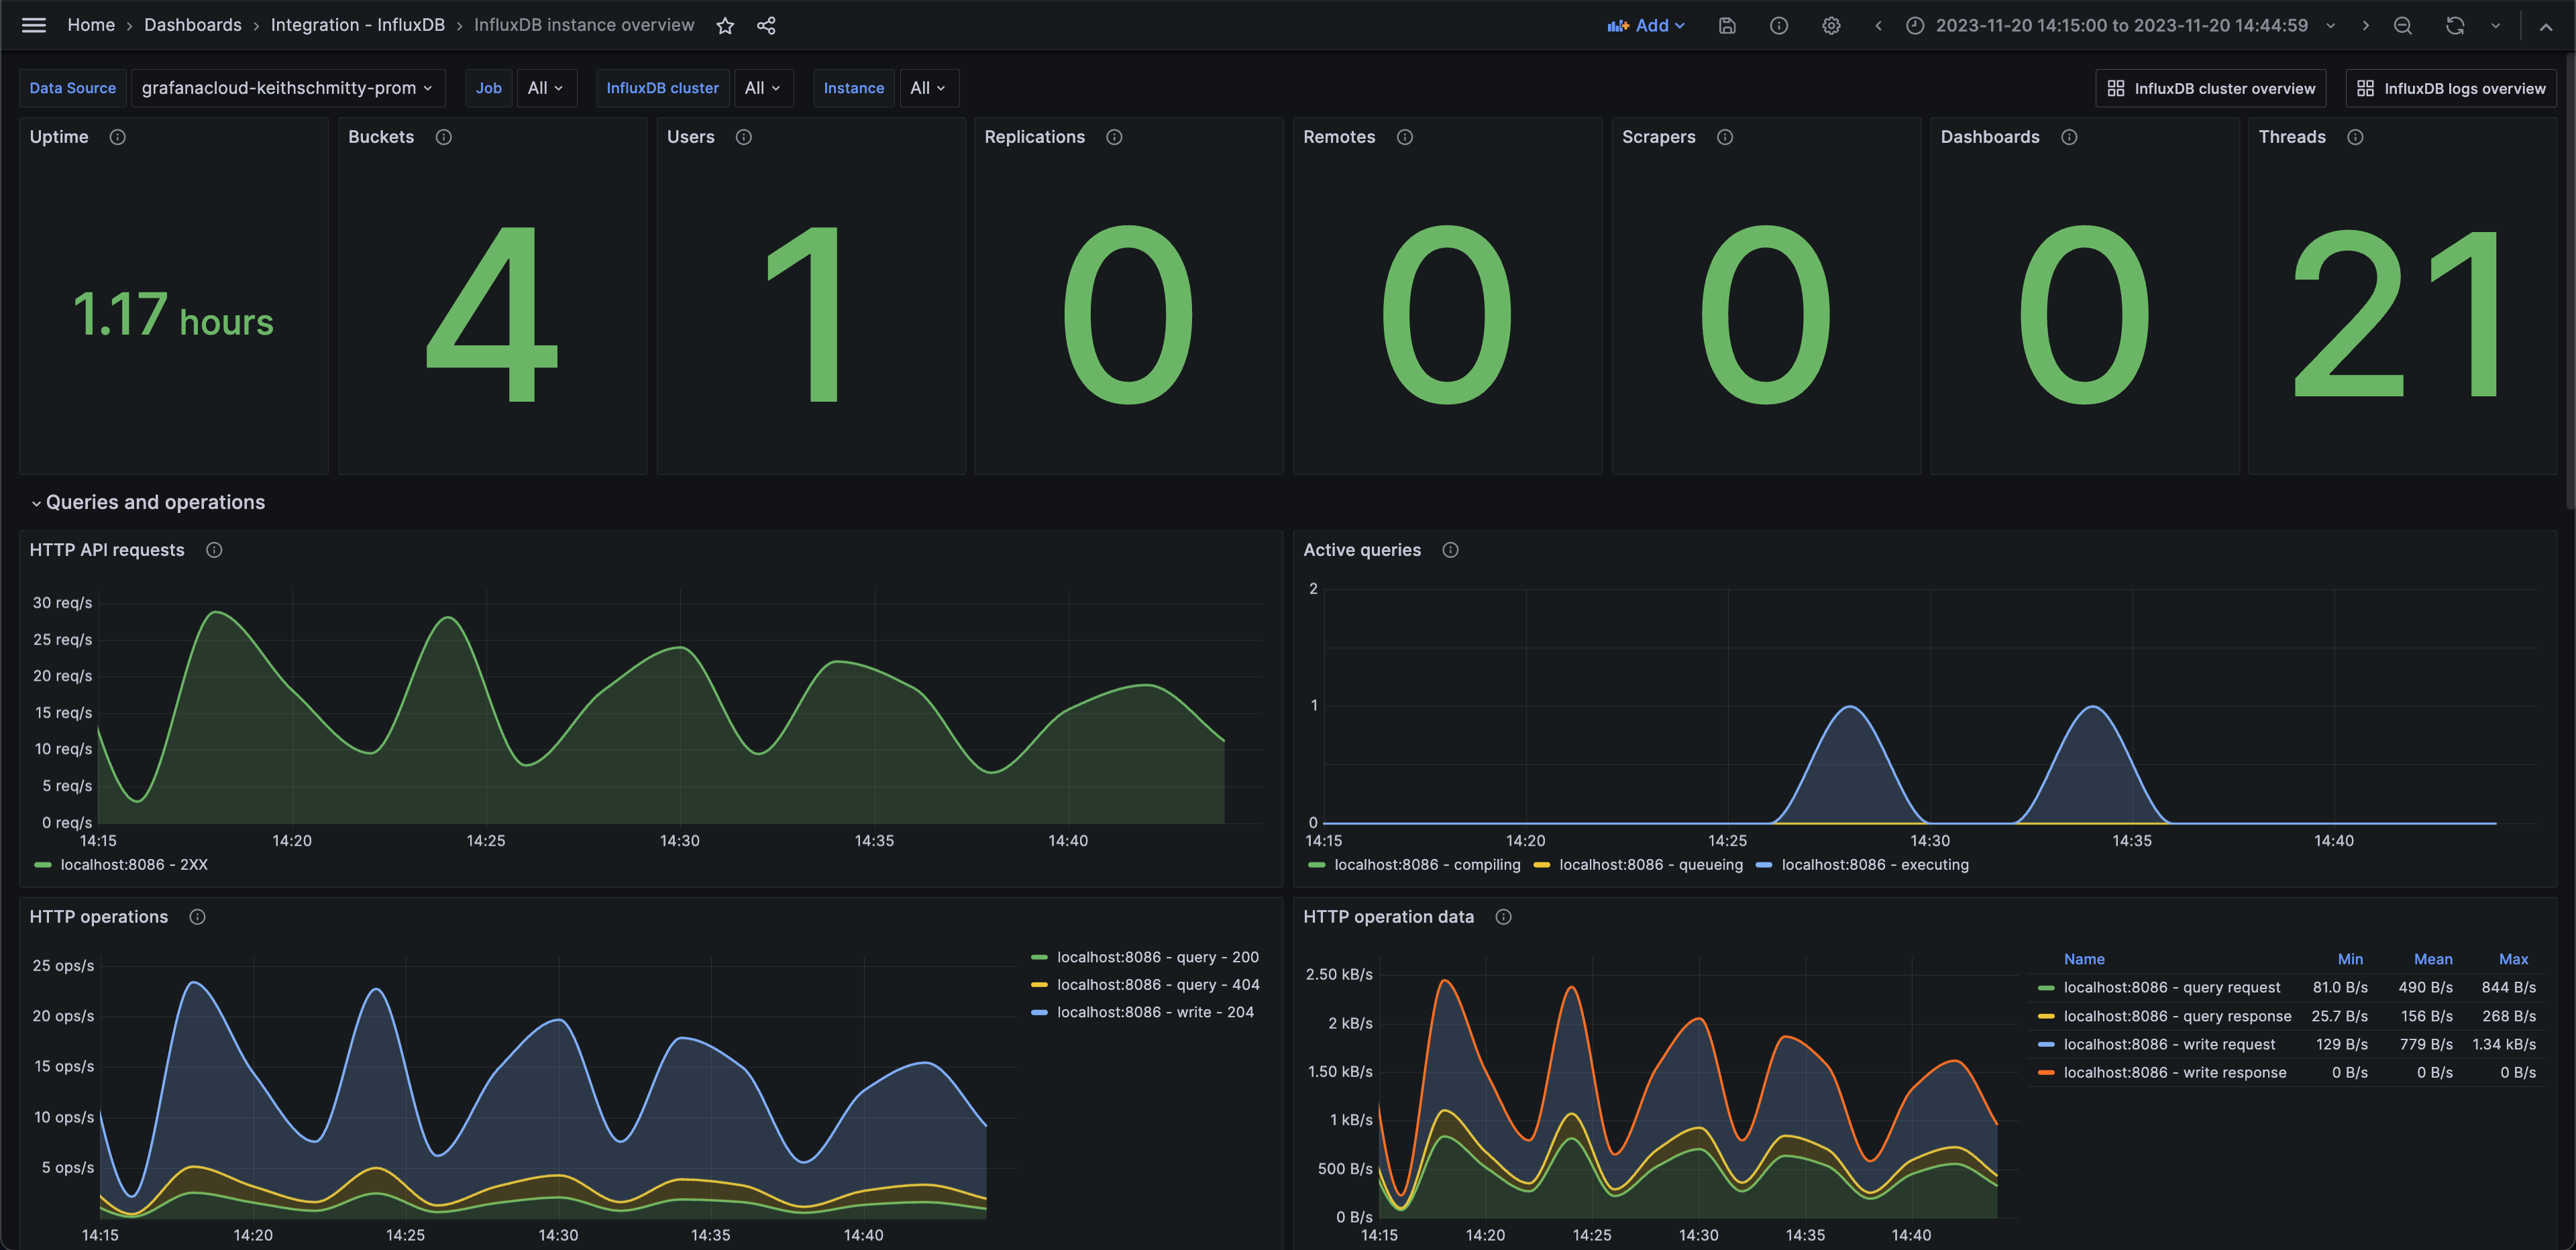
InfluxDB 实例概览(stats)

InfluxDB 实例概览(http)
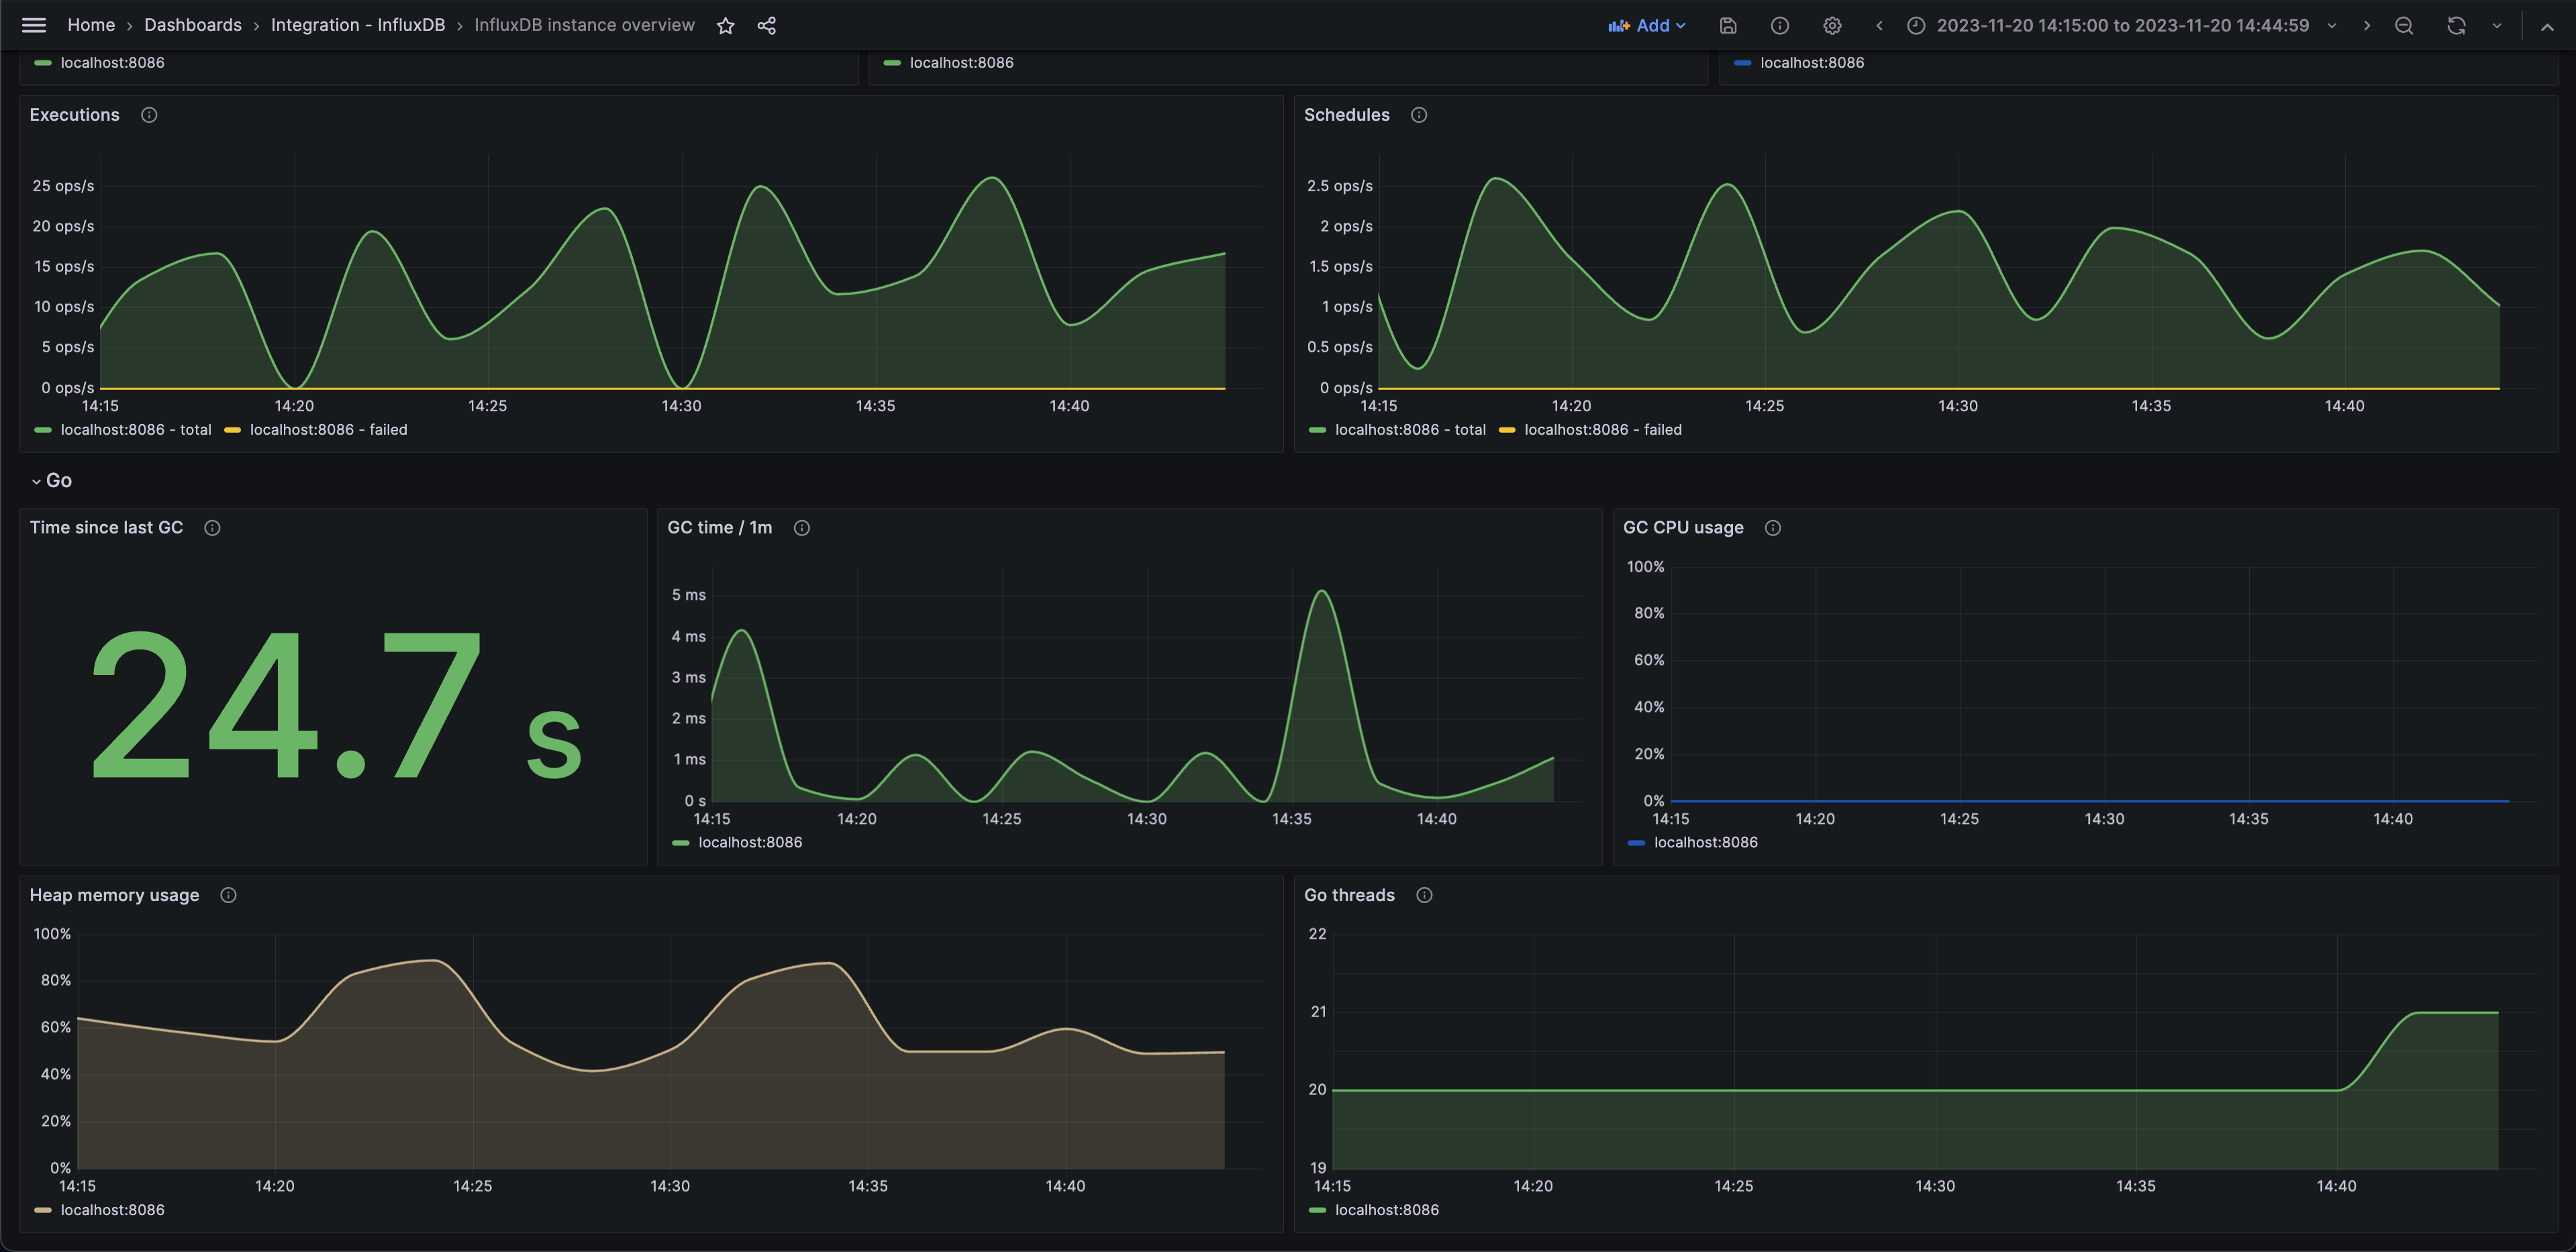
InfluxDB 实例概览(任务)

InfluxDB 日志概览
包含的主要指标
boltdb_reads_total
boltdb_writes_total
go_gc_duration_seconds_sum
go_memstats_gc_cpu_fraction
go_memstats_heap_alloc_bytes
go_memstats_heap_idle_bytes
go_memstats_last_gc_time_seconds
go_threads
http_api_request_duration_seconds_sum
http_api_requests_total
http_query_request_bytes
http_query_request_count
http_query_response_bytes
http_write_request_bytes
http_write_request_count
http_write_response_bytes
influxdb_buckets_total
influxdb_dashboards_total
influxdb_remotes_total
influxdb_replications_total
influxdb_scrapers_total
influxdb_uptime_seconds
influxdb_users_total
influxql_service_executing_duration_seconds_sum
influxql_service_requests_total
qc_compiling_active
qc_executing_active
qc_queueing_active
task_executor_total_runs_active
task_executor_workers_busy
task_scheduler_current_execution
task_scheduler_total_execute_failure
task_scheduler_total_execution_calls
task_scheduler_total_schedule_calls
task_scheduler_total_schedule_fails
up
包含的主要警报规则
InfluxDBWarningTaskSchedulerHighFailureRate
InfluxDBCriticalTaskSchedulerHighFailureRate
InfluxDBHighBusyWorkerPercentage
InfluxDBHighHeapMemoryUsage
InfluxDBHighAverageAPIRequestLatency
InfluxDBSlowAverageIQLExecutionTime