
为何在 Grafana Cloud 中使用 Microsoft Azure 可观测性?
简单快捷的设置
无需本地代理或复杂配置,即可安全地将 Microsoft Azure 资源连接到 Grafana Cloud。
统一您的 Microsoft Azure 数据
将 Microsoft Azure 服务的指标和日志集成到由开源驱动且为规模化构建的统一后端中。
控制成本
从您的 Microsoft Azure 资源中选择并聚合所需的精确指标,优化性能监控和成本管理。
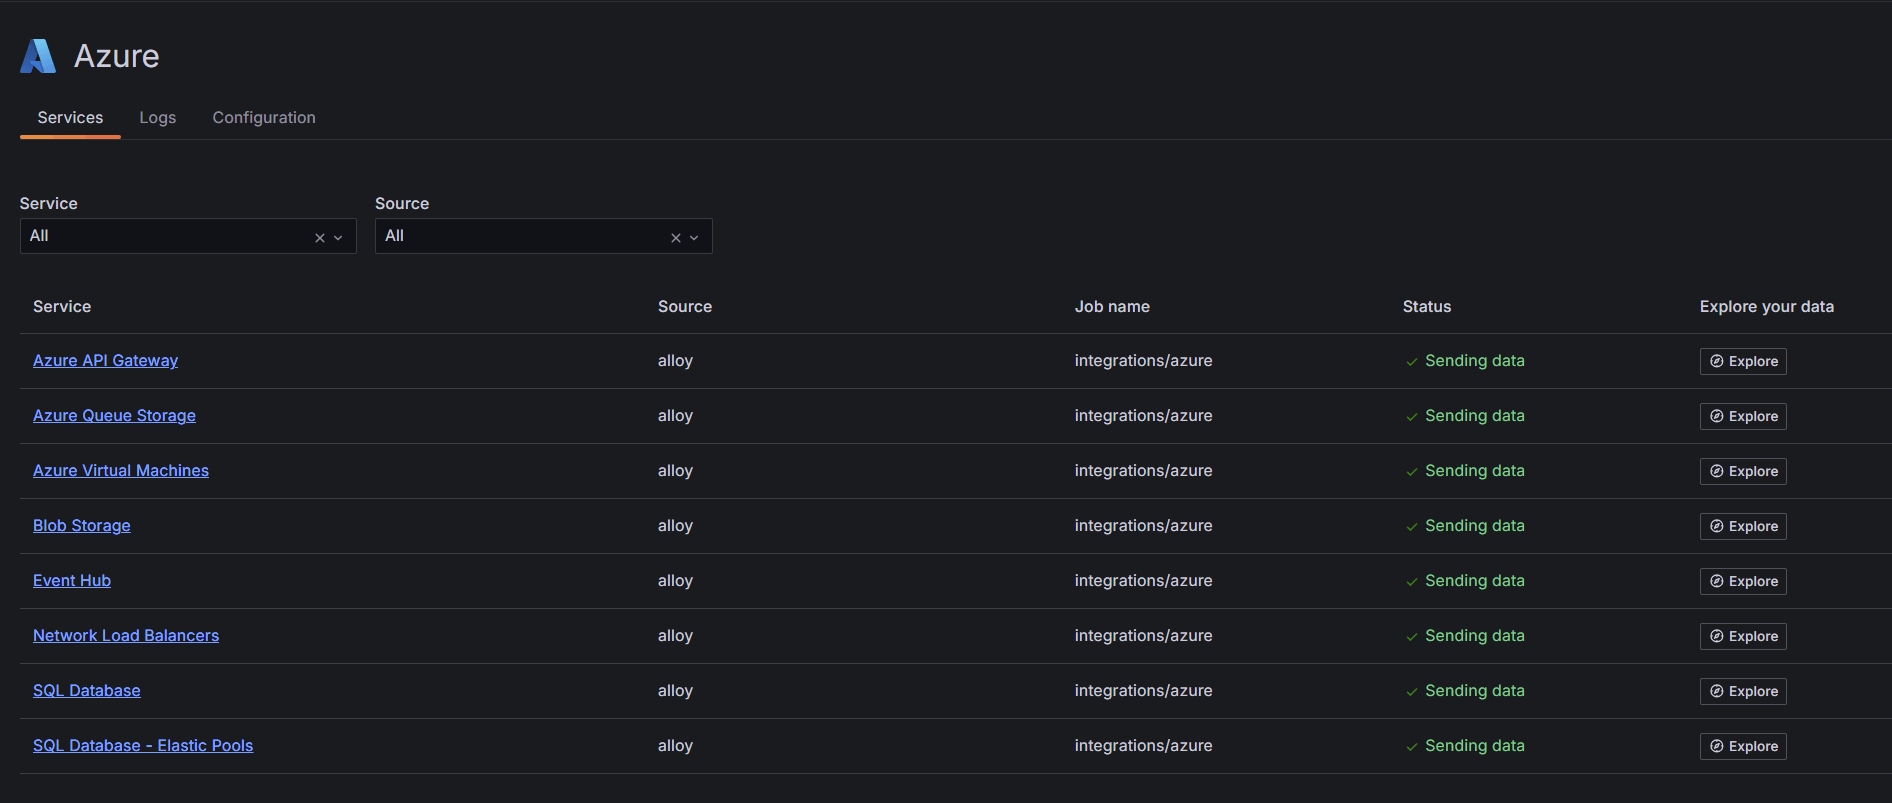
一个 Microsoft Azure 可观测性工具,多种连接方式
使用适合您需求的集成,将日志和指标发送到 Microsoft Azure
- Microsoft Azure 指标
- 用于指标的 Microsoft Azure Monitor
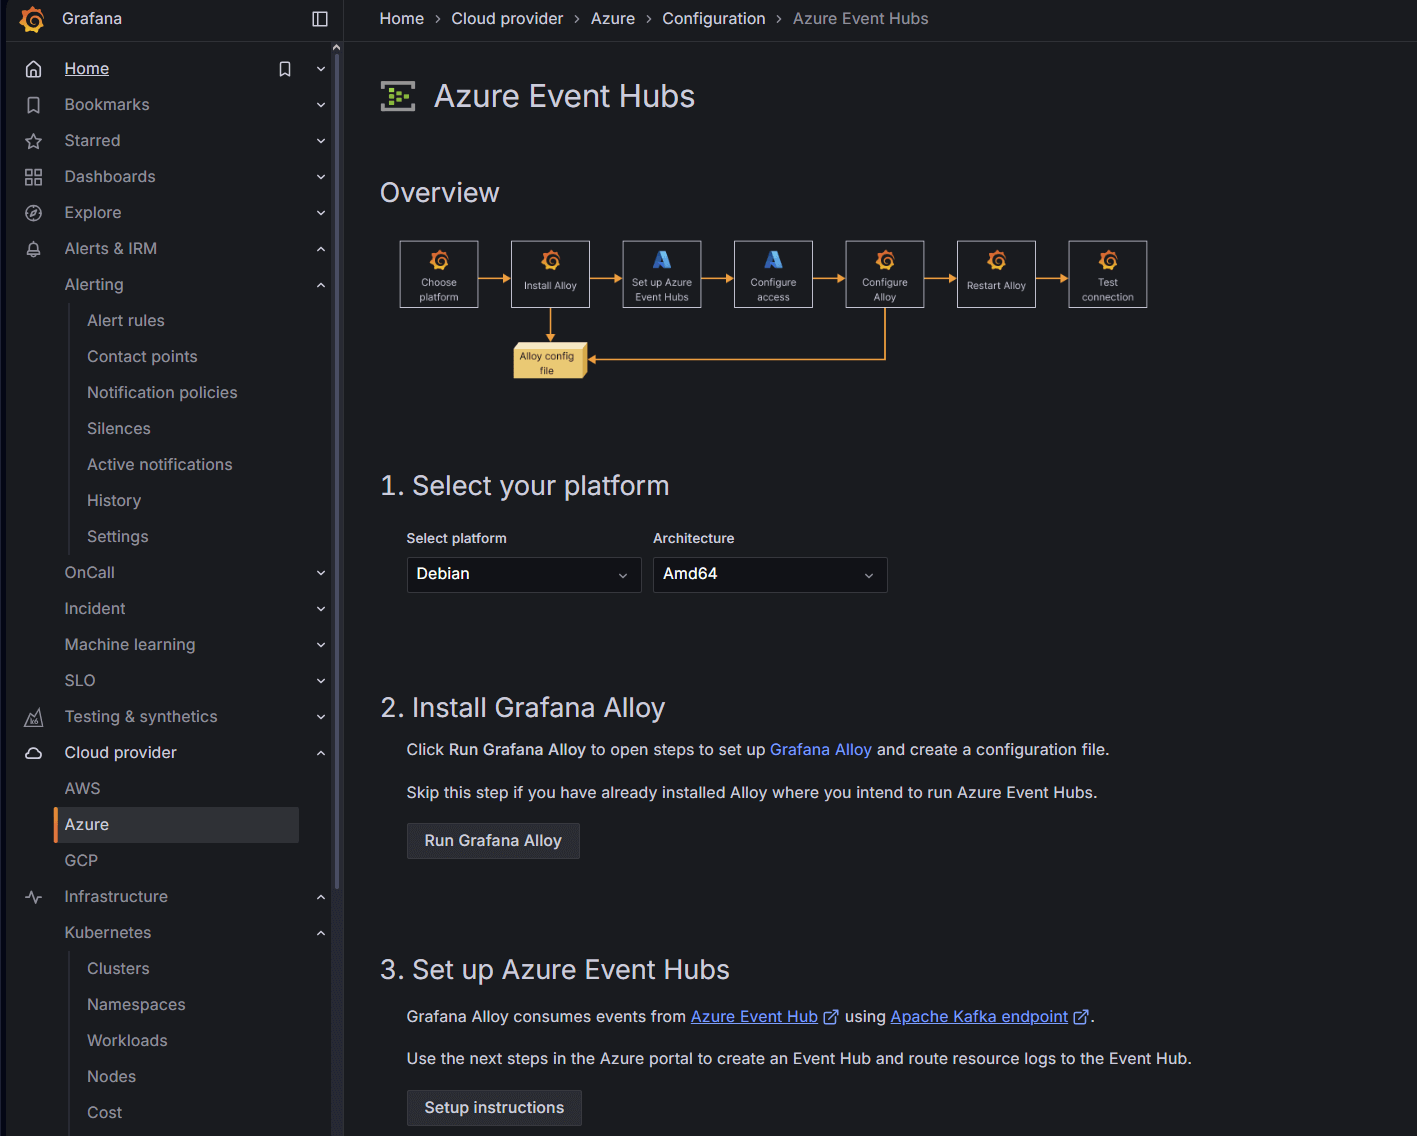
- 用于日志的 Microsoft Azure Event Hubs
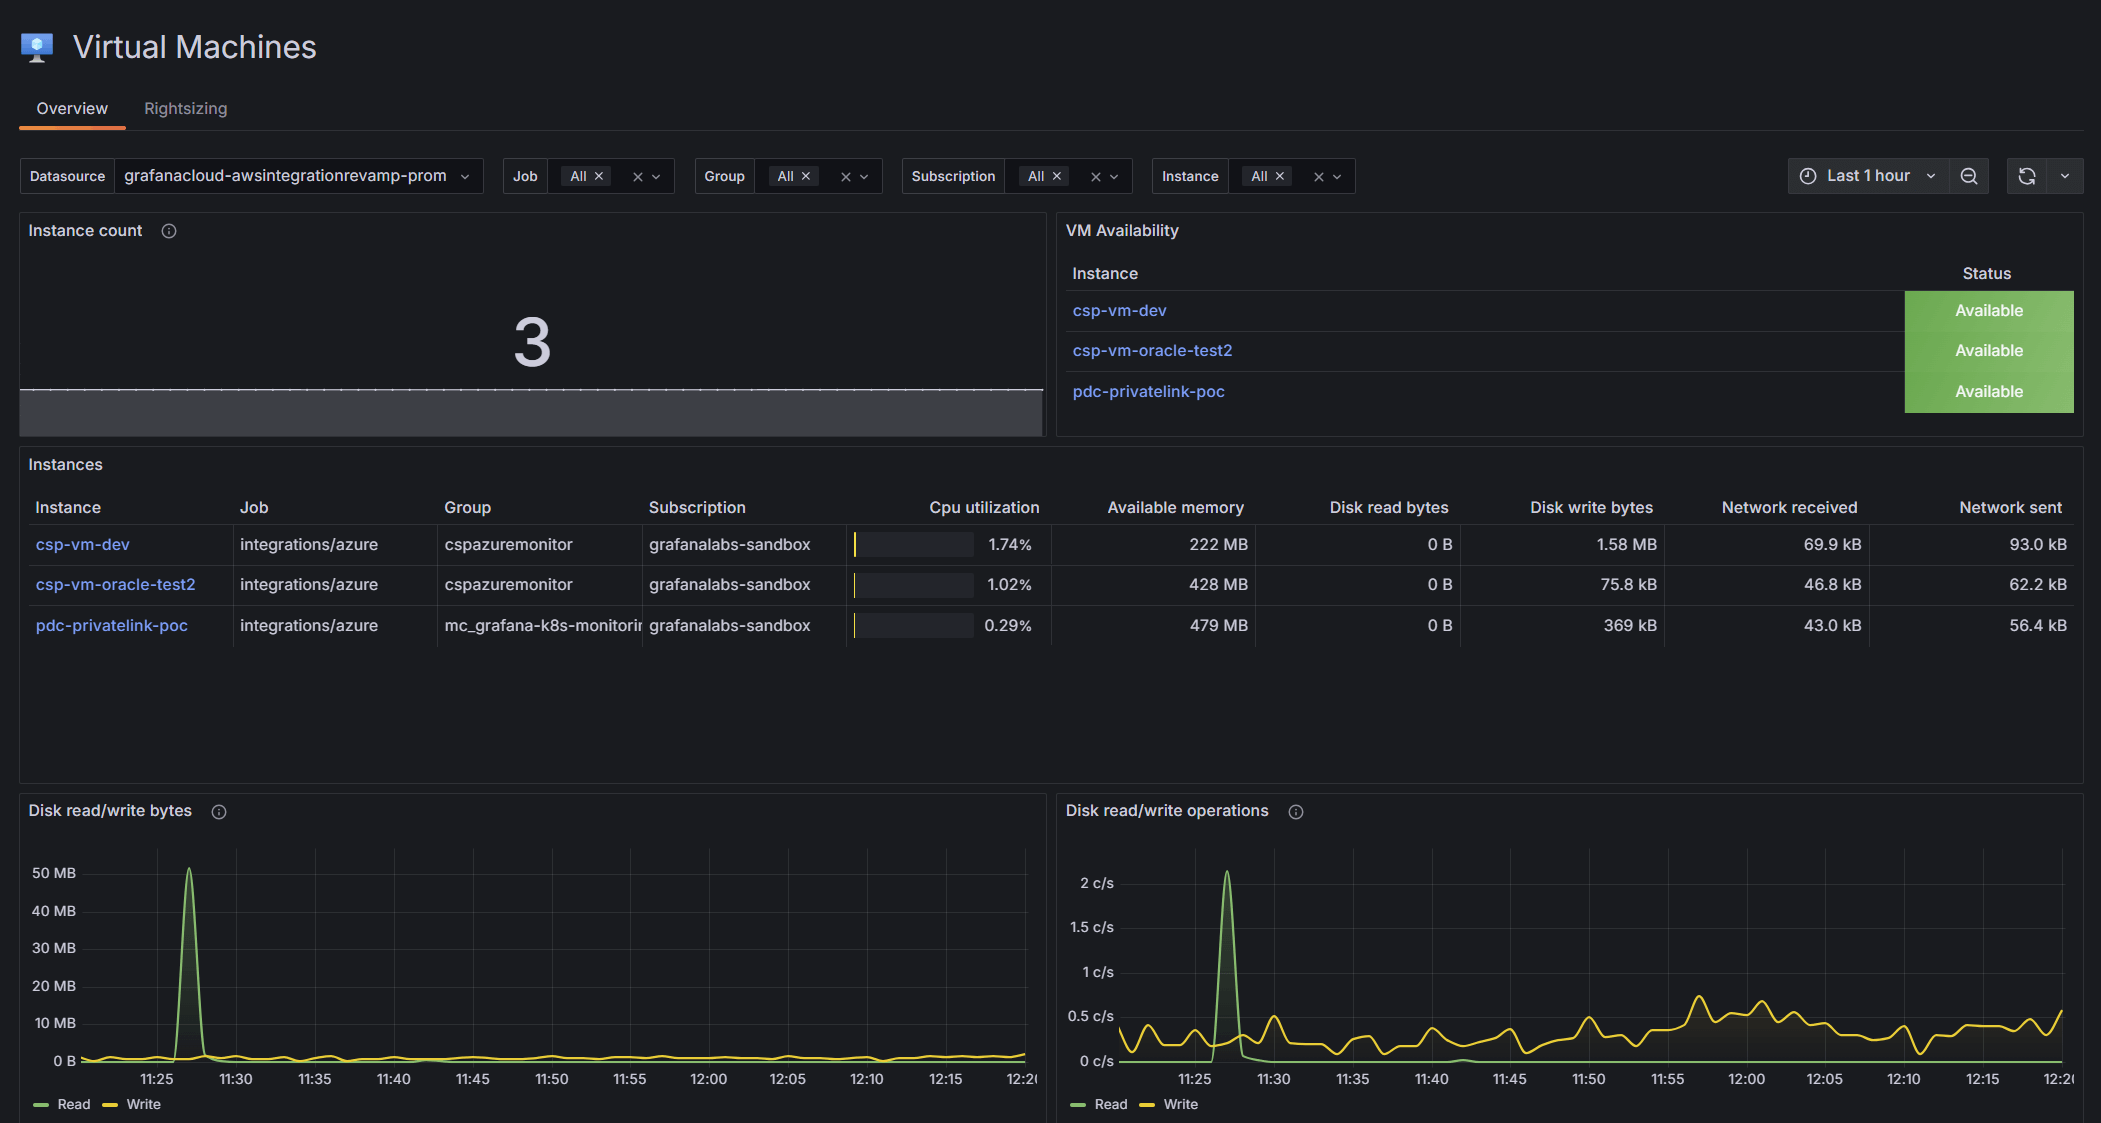
专用的虚拟机视图
通过专门的可视化,深入了解您的 Microsoft Azure 虚拟机,帮助您监控关键指标、优化资源并做出数据驱动的决策。
- 深入分析 Microsoft Azure 虚拟机,获取利用率和性能洞察
- 按作业、组、订阅和实例筛选实例
适用于 Microsoft Azure 服务的预构建仪表盘
通过流行的 Microsoft Azure 资源的预配置仪表盘立即获取洞察,例如
- Microsoft Azure Blob 存储
- Microsoft Azure Event Hubs
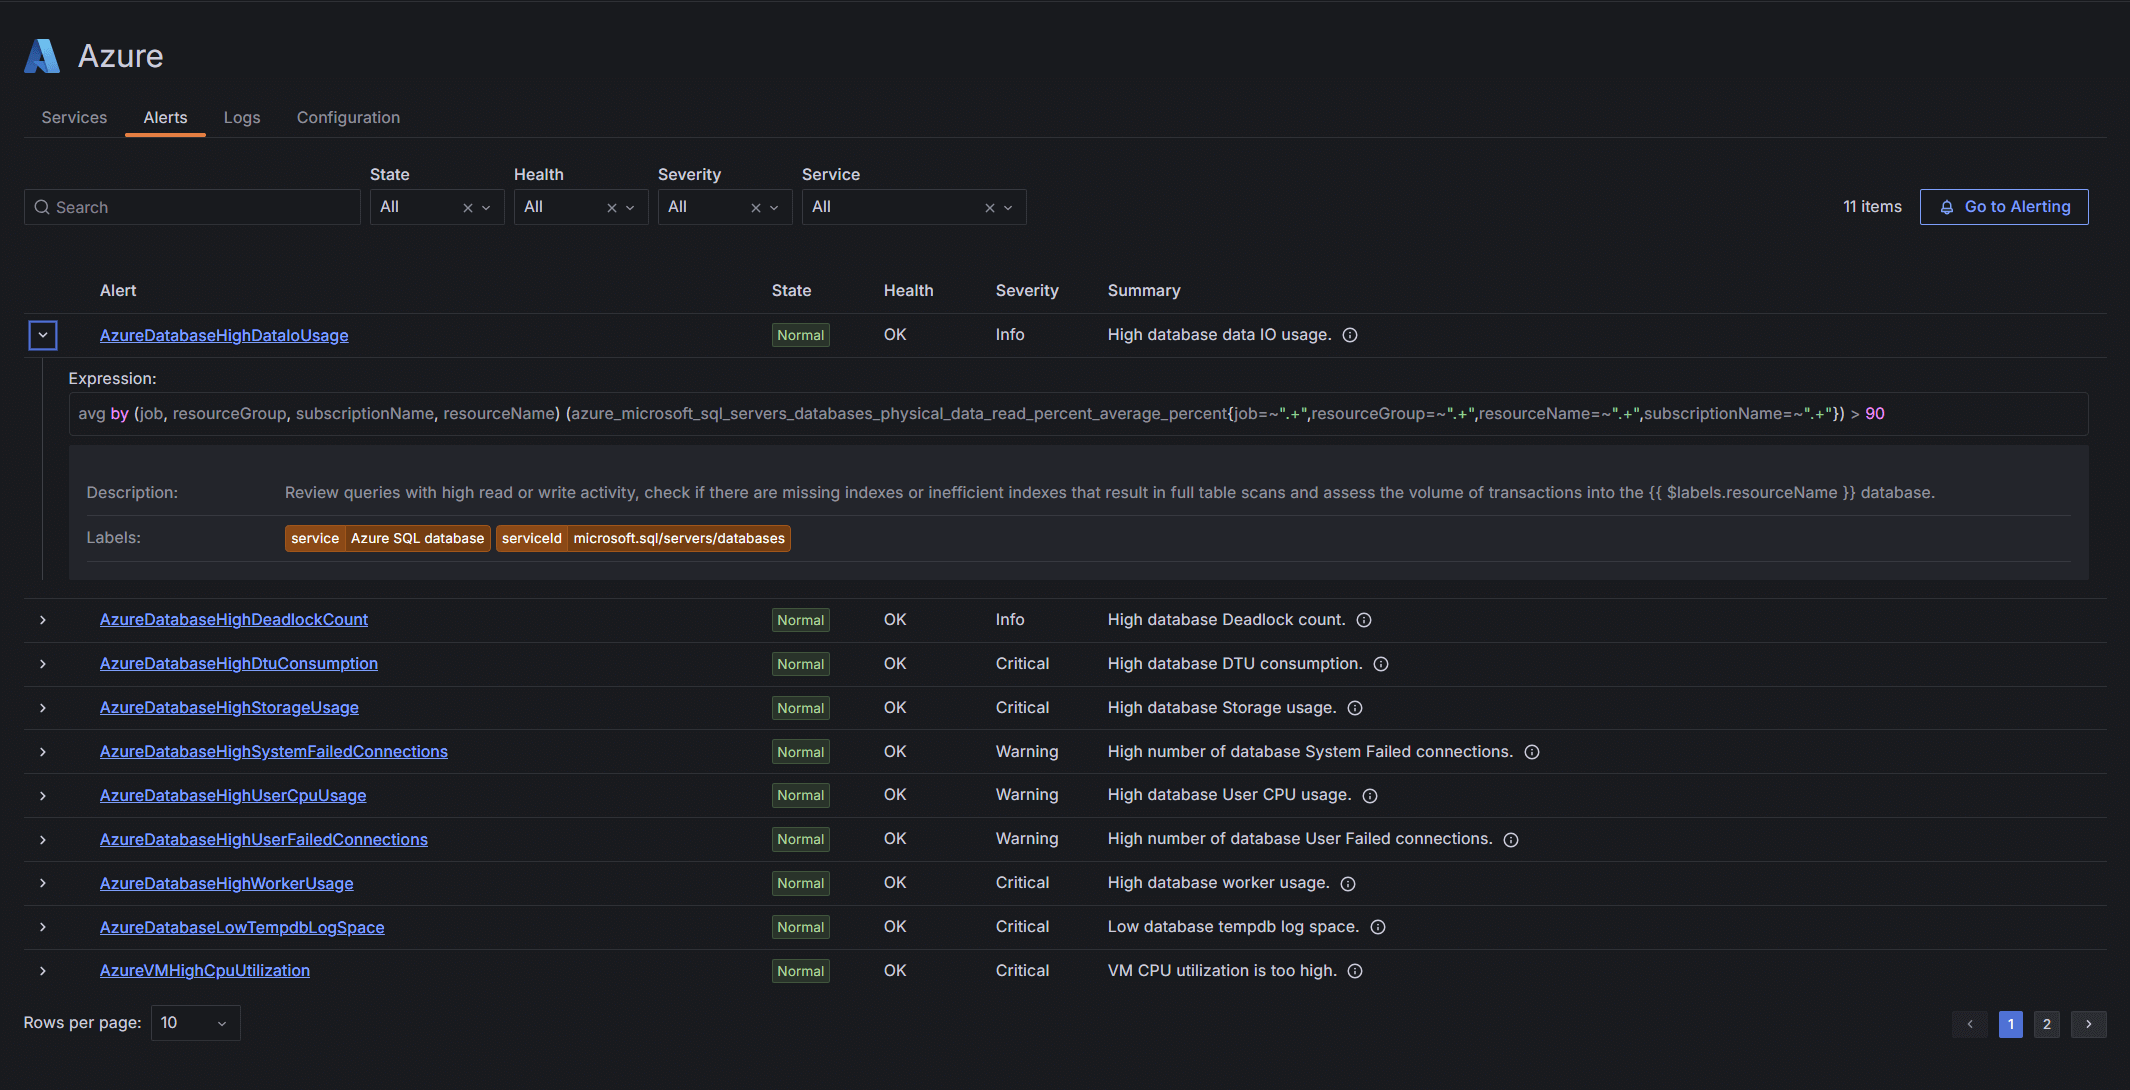
- Microsoft Azure SQL 数据库
- Microsoft Azure 虚拟机
- Microsoft Azure Front Door
- Microsoft Azure Service Bus
- Microsoft Azure 虚拟网络
- Azure SQL 数据库弹性池
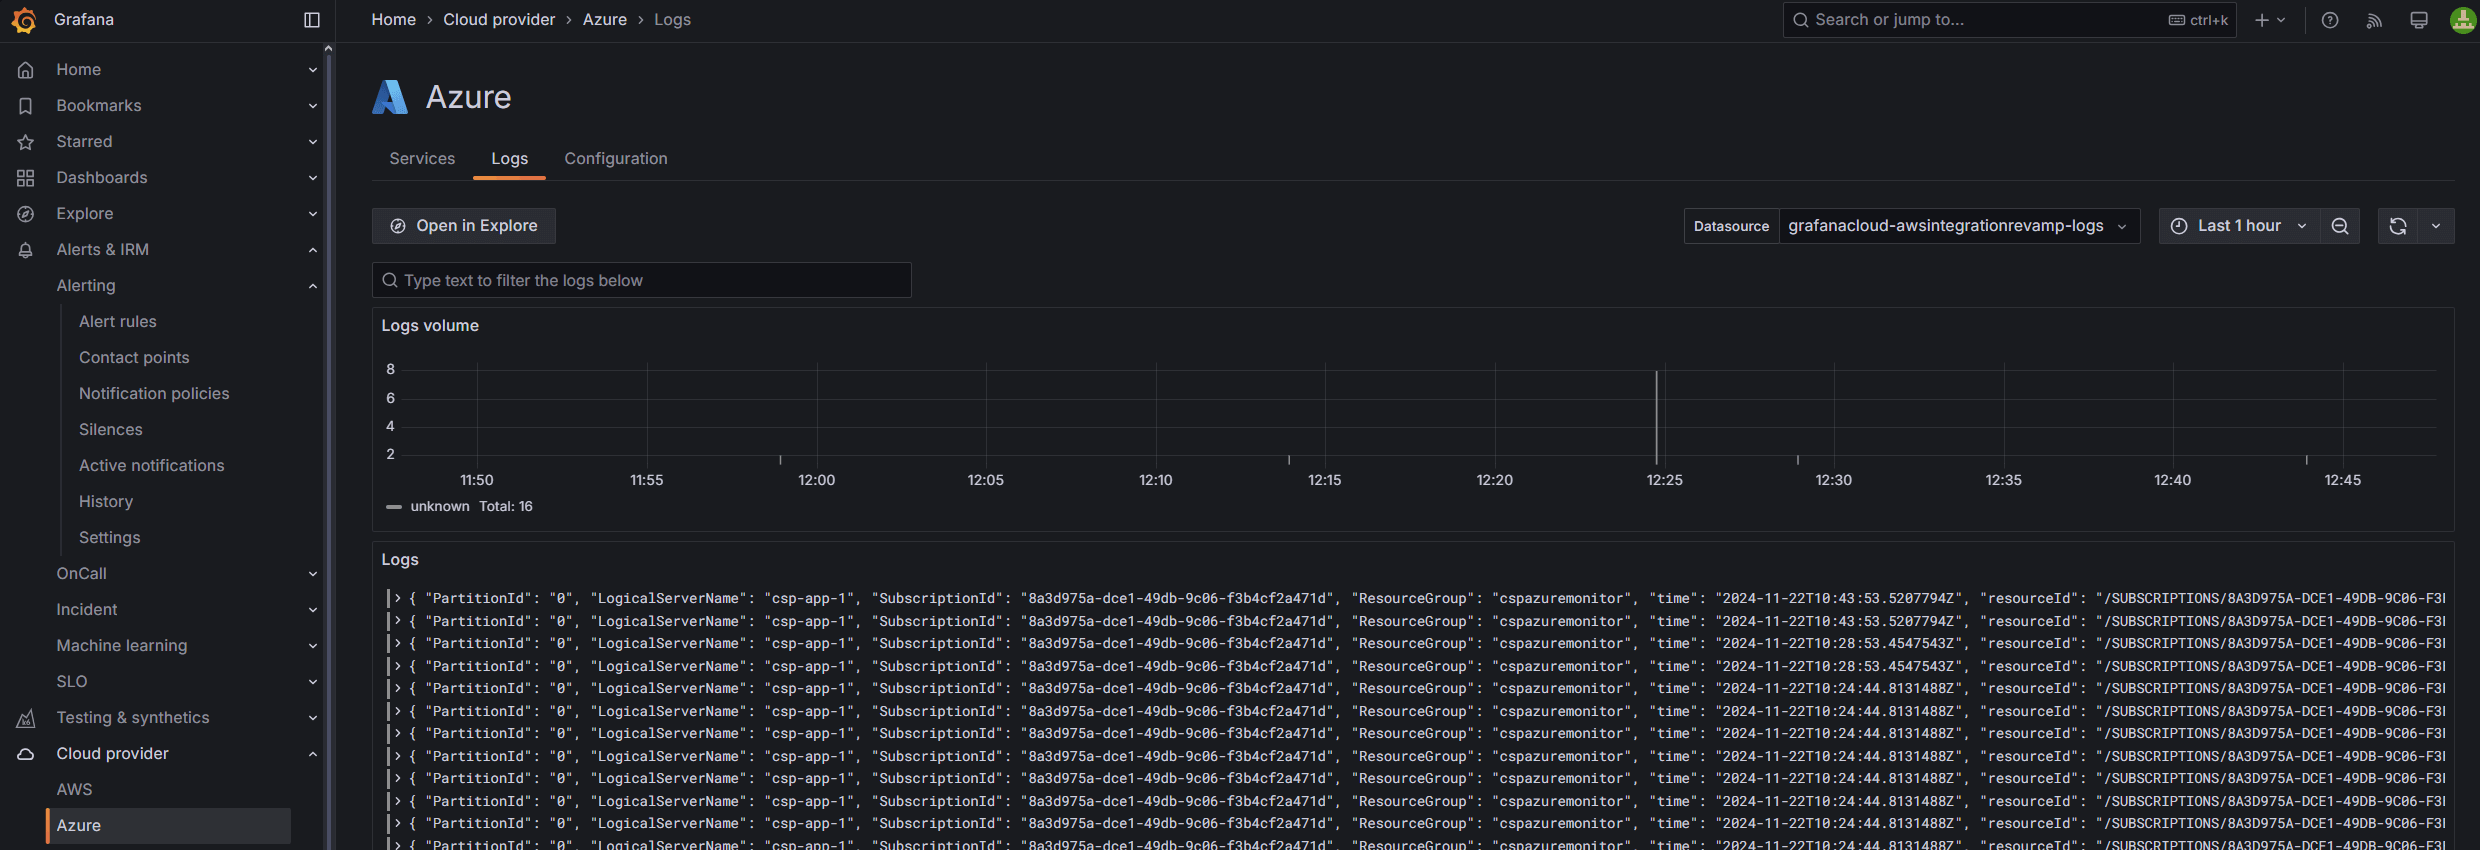
适用于 Microsoft Azure 服务的专用日志视图
- 关联跨服务的事件
- 识别根本原因、趋势、异常或潜在漏洞
- 准确定位所有服务的性能下降或级联故障
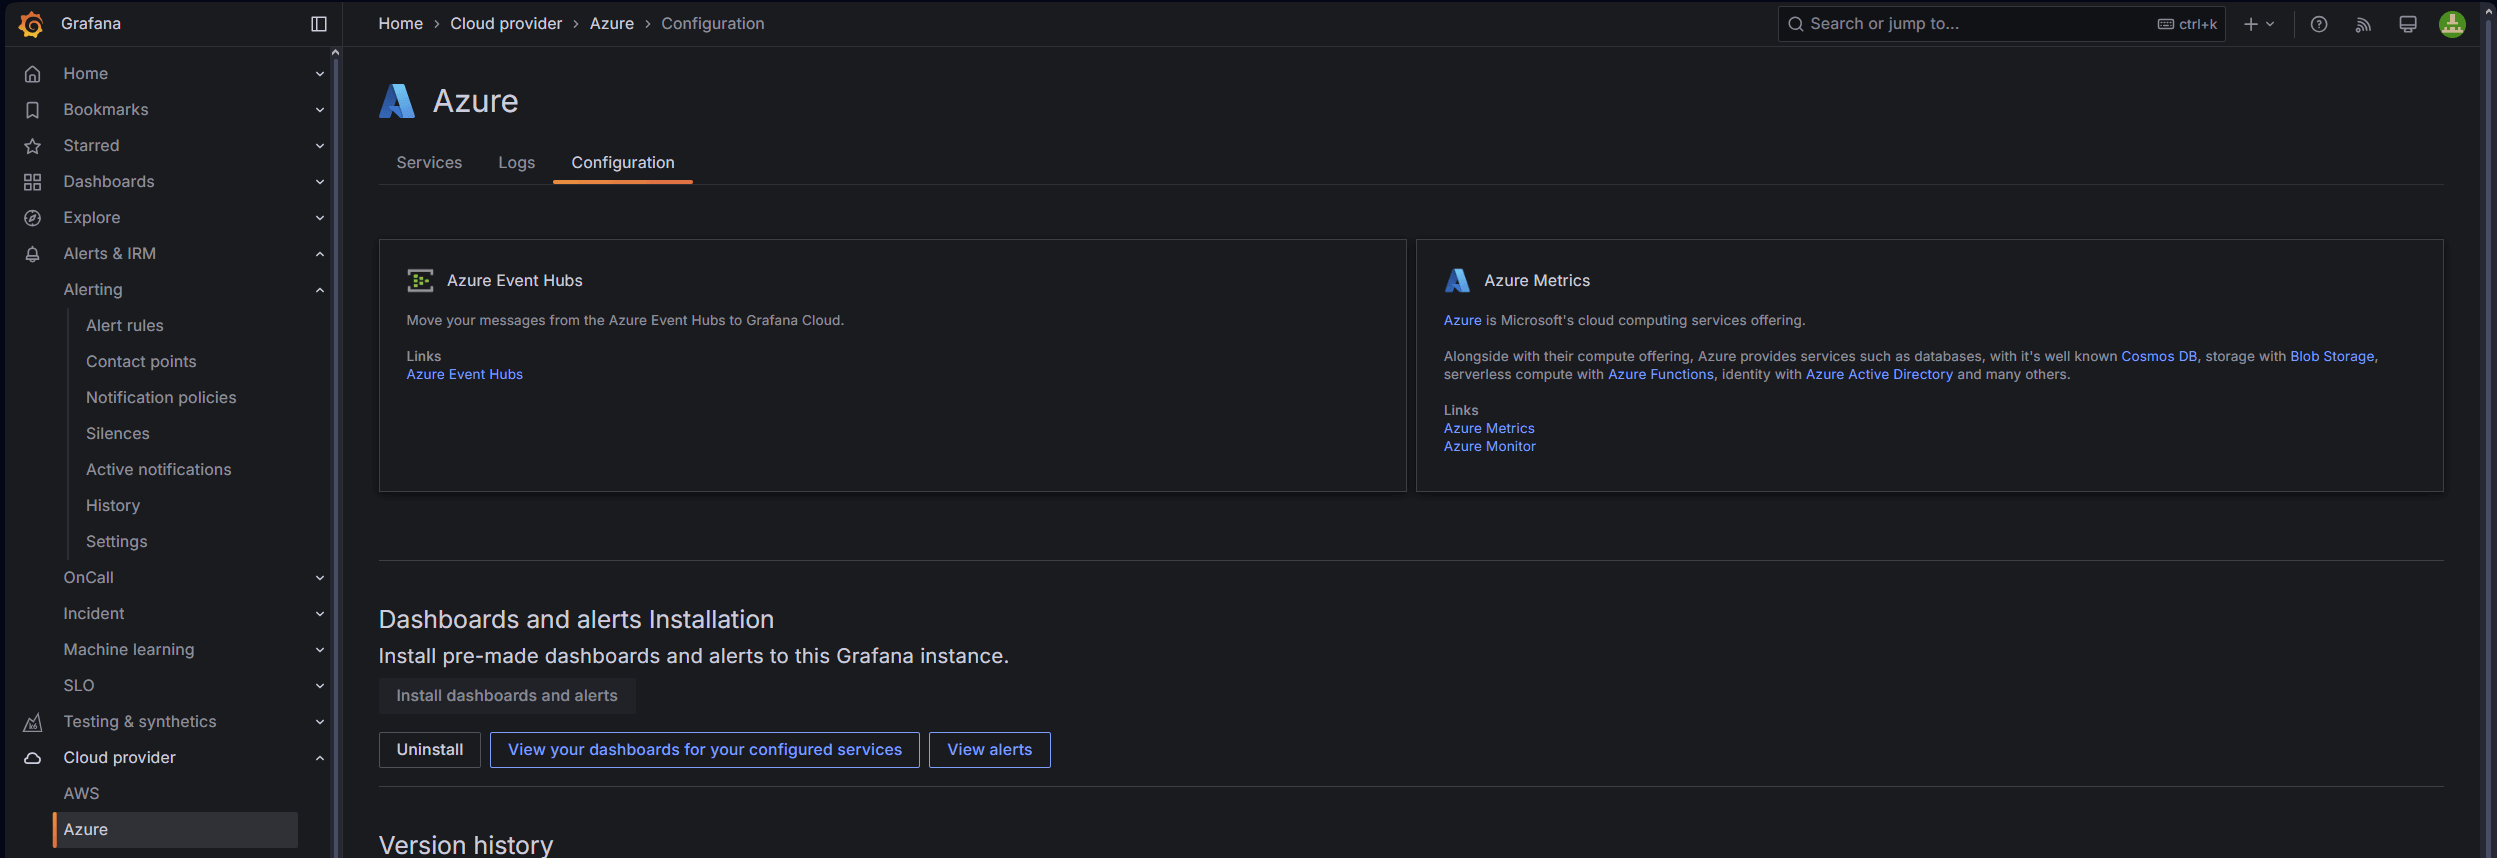
简单的指标和日志摄取
轻松配置您的 Microsoft Azure 指标和日志。
- 使用 Grafana Alloy 轻松设置 Microsoft Azure Event Hubs、Microsoft Azure 指标和 Microsoft Azure Monitor
- 使用 Terraform 配置无服务器 Microsoft Azure 指标
在一个地方观测您的所有云环境
将您的 Microsoft Azure 数据与来自其他数据源(包括其他公共云)的指标、日志等集中在一起。
- 在 Grafana Cloud 中统一数据,实现快速、无限制的查询
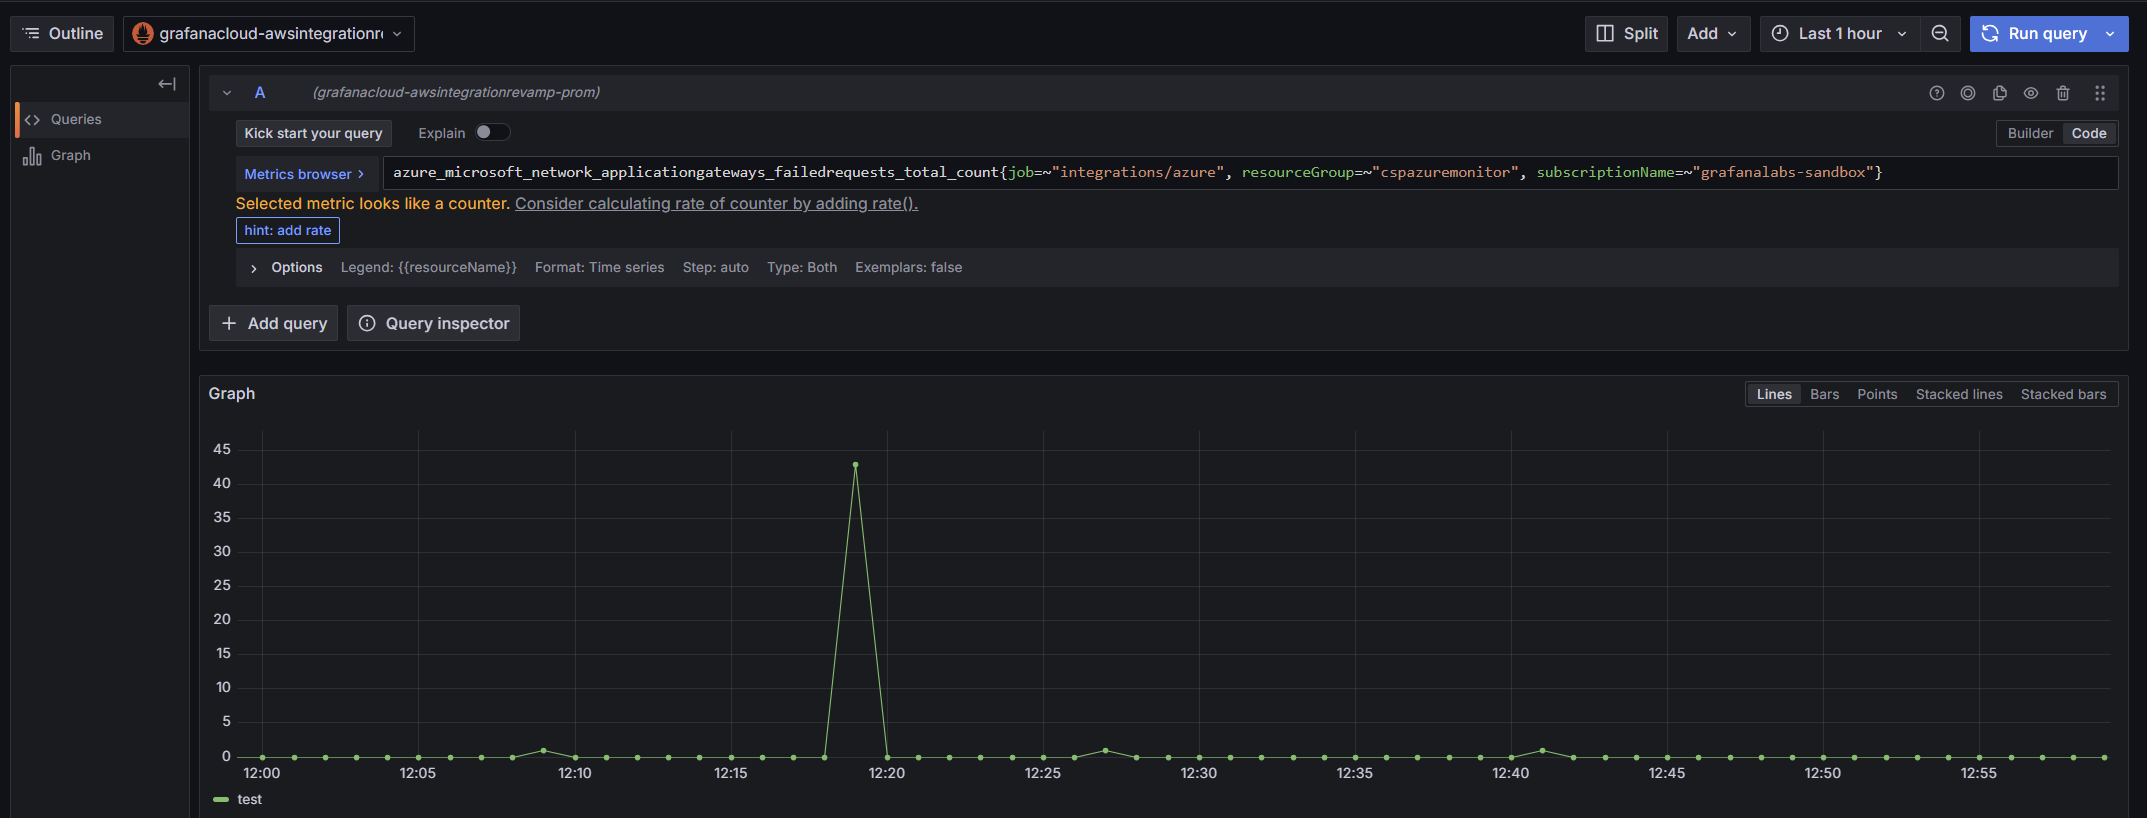
- 使用基于 PromQL 的查询语言,通过单个查询跨 Microsoft Azure 区域和服务创建告警并探索您的数据
- 在虚拟私有云 (VPC)、受支持的 Microsoft Azure 服务和您的本地网络之间安全地发送您的遥测数据,而无需将流量暴露给公共互联网,节省出口费用
入门很简单
查看完整的实施细节和最佳实践
1
注册
创建您的免费 Grafana Cloud 帐户。
2
连接您的数据
只需点击几下,即可为预构建的 Microsoft Azure 仪表盘设置默认配置。
3
部署
数据将从 Microsoft Azure 流入 Grafana Cloud。