
插件 〉Altinity ClickHouse 插件

Altinity ClickHouse 插件
![]()
Altinity Grafana 数据源插件 for ClickHouse® (支持 Grafana 4.6+)
Altinity ClickHouse 数据源插件支持将 ClickHouse 作为后端数据库。
该插件最初由 Vertamedia 开发,自 2020 年起由 Altinity 维护。
快速入门
适用于 3.0.0 版本之前插件的 Grafana 10+ 安装说明
较旧版本的 Altinity ClickHouse 数据源插件 for Grafana 是用 Angular 编写的。因此您可能会看到如下警告
Angular plugin
This data source plugin uses a deprecated, legacy platform based on AngularJS and will stop working in future releases of Grafana.
请勿担心此警告消息,该插件在 Grafana 11 发布之前仍然可用,之后需要升级到 Altinity ClickHouse 数据源插件 for Grafana 的 3.x 版本。
适用于 2.2.0 版本之前插件的 Grafana 7+ 安装说明
当 2.0.x 和 2.1.x 版本的 vertamedia-clickhouse-grafana 插件发布时,Grafana 团队没有为社区插件提供可用的签名方法。当前的签名流程在 grafana.com 上有描述
因此,为了正确安装 2.0.x 和 2.1.x 插件,您需要更改配置选项
[plugins]
allow_loading_unsigned_plugins=vertamedia-clickhouse-datasource
或设置环境变量
GF_PLUGINS_ALLOW_LOADING_UNSIGNED_PLUGINS=vertamedia-clickhouse-datasource
您可以从 grafana.com 安装插件
或者
将文件复制到您的 Grafana 插件目录。重启 Grafana,在 Configuration -> Datasources -> New 中检查数据源列表,选择 ClickHouse 选项。


功能
- 通过 HTTP / HTTPS 访问 CH
- 查询设置
- 原始 SQL 编辑器
- 查询格式化
- 宏支持
- 附加函数
- 模板
- 表格视图
- SingleStat 视图
- 即席过滤器
- 注解
- 告警支持
- 直方图支持
- 日志支持
- 火焰图支持
- 追踪支持
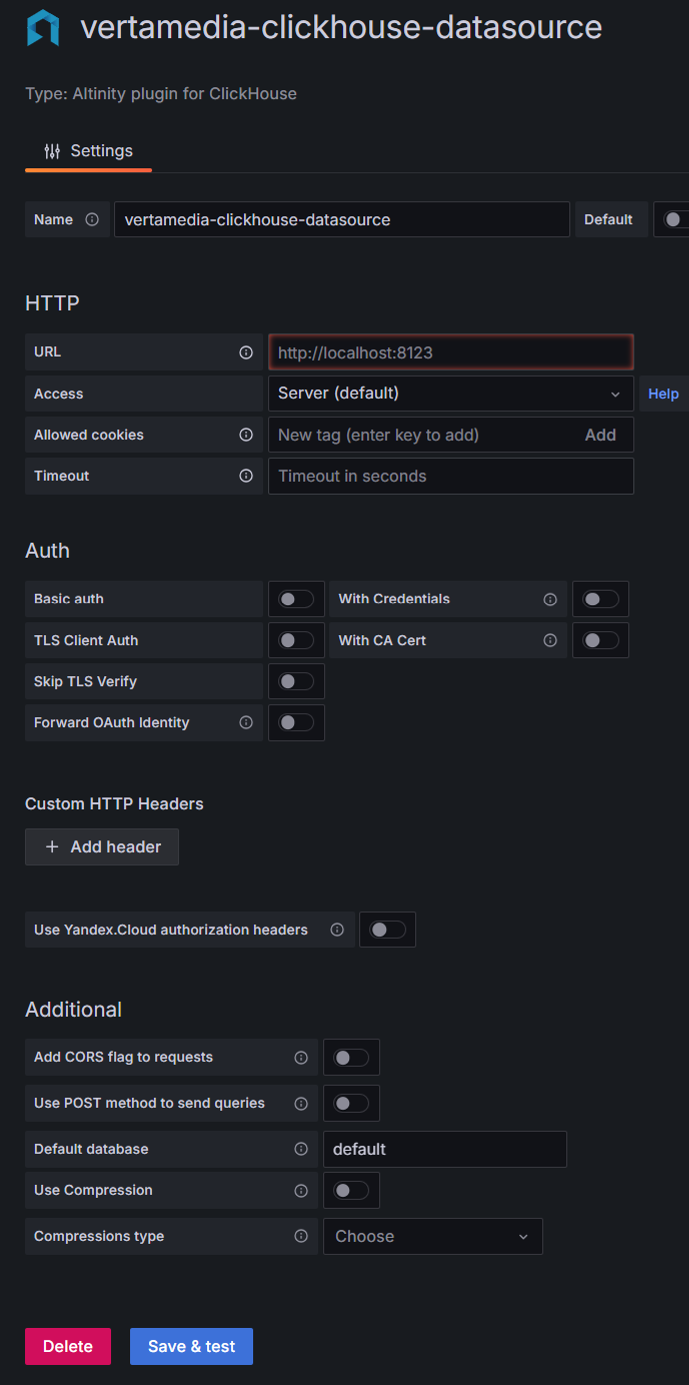
通过 HTTP / HTTPS 访问 ClickHouse
页面配置是标准的

有一个小特性 - ClickHouse 将 HTTP Basic Authentication 凭据视为数据库用户,并将尝试使用其名称运行查询。
CHProxy(可选)
使用 CHProxy 将带来附加功能
- 按照此处所示轻松设置对 ClickHouse 的 HTTPS 访问,以提供安全访问。
- 按照此处所示限制来自 Grafana 请求的并发和执行时间,以防止 Grafana 导致 ClickHouse 过载。
- 保护仪表盘免受大量请求突发的影响。CHProxy 允许将请求排队并按顺序执行。要了解更多信息,请阅读 CHProxy 页面上关于
max_queue_size和max_queue_time参数的内容。 - 按照此处所示对最频繁的查询进行响应缓存。
缓存将保护 ClickHouse 免受过度刷新,对于热门仪表盘来说将是最佳选择。
提示 - 如果您需要缓存像
过去 24 小时这样时间戳不断变化的请求,请尝试在原始编辑器中使用Round选项
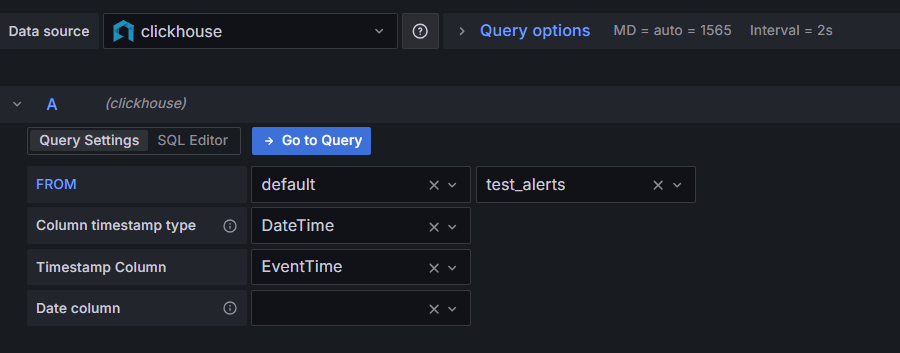
查询设置
查询设置界面

第一行 FROM 包含两个选项:数据库和表。表的值取决于所选的数据库。后续行包含时间过滤的选择器
时间戳列 时间
- DateTime (DateTime)
- DateTime64 (DateTime64)
- TimeStamp (UInt32)。
时间戳列 日期列
Timestamp column对于基于时间的宏和函数是必需的,因为所有分析都基于这些值。插件将尝试自动检测 Date、Date32 列
Go to Query 按钮只是切换到原始 SQL 编辑器的一个开关
原始 SQL 编辑器
原始编辑器允许编写自定义 SQL 查询

原始编辑器允许输入查询,获取关于函数和宏的信息,并像 ClickHouse 那样格式化查询。要在服务器上执行查询,请点击“运行查询”或只需离开 SQL 编辑器文本区域的焦点即可。
在编辑器下方,您可以找到一些选项,用于设置舍入、时间列步长以及向 SQL 查询添加 Add metadata,这有助于了解哪个仪表盘和用户对您的 ClickHouse 服务器产生了工作负载。
点击 Show Generated SQL 查看原始查询(所有宏和函数都已被替换),该查询将直接发送到 ClickHouse。
宏支持
插件支持以下宏
- $table - 被 Query Builder 中选定的表名替换
- $dateCol - 被 Query Builder 中 Column:Date 的值替换
- $dateTimeCol - 被 Query Builder 中 Column:DateTime 或 Column:TimeStamp 的值替换
- $from - 被 UI 中选定的“时间范围:从”的时间戳(带毫秒)/1000 的值替换
- $to - 被 UI 中选定的“时间范围:到”的时间戳(带毫秒)/1000 的值替换
- $interval - 被选定的“按时间间隔分组”的值(以秒为单位)替换
- $timeFilter - 被当前选定的“时间范围”替换。需要选择 Column:Date 和 Column:DateTime 或 Column:TimeStamp。
- $timeFilterByColumn($column) - 被作为
$column参数传入的列的当前选定“时间范围”替换。在查询或查询变量中使用它,格式如...WHERE $timeFilterColumn($column)...或...WHERE $timeFilterColumn(created_at)...。 - $timeSeries - 被特殊的 ClickHouse 结构替换,用于将结果转换为时间序列数据。使用格式如 "SELECT $timeSeries..."。
- $naturalTimeSeries - 被特殊的 ClickHouse 结构替换,用于将结果按逻辑/自然细分转换为时间序列。使用格式如 "SELECT $naturalTimeSeries..."。
- $unescape - 通过移除单引号来解除变量值的转义。用于多值字符串变量,例如: "SELECT $unescape($column) FROM requests WHERE $unescape($column) = 5"
- $adhoc - 被渲染的即席过滤表达式替换,如果不存在即席过滤器则替换为 "1"。由于即席过滤器仅自动应用于外部查询,因此该宏可用于内部查询的过滤。
在原始编辑器中输入宏名称可查看其描述
函数
函数只是 SQL 查询的模板,您可以在原始 SQL 编辑器模式下查看最终查询。如果您需要额外的复杂性,只需将原始 SQL 复制到原始编辑器中并进行相应更改即可。请记住,仍然可以使用宏。
由于查询分析能力有限,函数使用存在一些限制
- 必须在 Query Builder 中设置 Column:Date 和 Column:DateTime 或 Column:TimeStamp
- 查询必须以函数名称开头
- 每个查询只能使用一个函数
插件支持以下函数
$rate(cols...) - 将查询结果转换为“每间隔变化率”
示例用法
$rate(countIf(Type = 200) AS good, countIf(Type != 200) AS bad) FROM requests
查询将被转换为
SELECT
    t,
    good / runningDifference(t / 1000) AS goodRate,
    bad / runningDifference(t / 1000) AS badRate
FROM
(
    SELECT
        (intDiv(toUInt32(EventTime), 60)) * 1000 AS t,
        countIf(Type = 200) AS good,
        countIf(Type != 200) AS bad
    FROM requests
    WHERE ((EventDate >= toDate(1482796747)) AND (EventDate <= toDate(1482853383))) AND ((EventTime >= toDateTime(1482796747)) AND (EventTime <= toDateTime(1482853383)))
    GROUP BY t
    ORDER BY t
)
$columns(key, value) - 将值查询为 [key, value] 数组,其中 key 将用作标签
示例用法
$columns(OSName, count(*) c)
FROM requests
INNER JOIN oses USING (OS)
查询将被转换为
SELECT
    t,
    groupArray((OSName, c)) AS groupArr
FROM
(
    SELECT
        (intDiv(toUInt32(EventTime), 60) * 60) * 1000 AS t,
        OSName,
        count(*) AS c
    FROM requests
    INNER JOIN oses USING (OS)
    WHERE ((EventDate >= toDate(1482796627)) AND (EventDate <= toDate(1482853383))) AND ((EventTime >= toDateTime(1482796627)) AND (EventTime <= toDateTime(1482853383)))
    GROUP BY
        t,
        OSName
    ORDER BY
        t,
        OSName
)
GROUP BY t
ORDER BY t
这将有助于构建以下图表

$columnsMs(key, value) - 与 $columns 相同,但用于带毫秒的时间序列
示例用法
$columnsMs(OSName, count(*) c)
FROM requests
INNER JOIN oses USING (OS)
查询将被转换为
SELECT
    t,
    groupArray((OSName, c)) AS groupArr
FROM
(
    SELECT
        $timeSeriesMs AS t,
        OSName,
        count(*) AS c
    FROM requests
    INNER JOIN oses USING (OS)
    WHERE ((EventDate >= toDate(1482796627)) AND (EventDate <= toDate(1482853383))) AND ((EventTime >= toDateTime64(1482796627,3)) AND (EventTime <= toDateTime64(1482853383,3)))
    GROUP BY
        t,
        OSName
    ORDER BY
        t,
        OSName
)
GROUP BY t
ORDER BY t
$rateColumns(key, value) - 是 $columns 和 $rate 的组合
示例用法
$rateColumns(OS, count(*) c) FROM requests
查询将被转换为
SELECT
    t,
    arrayMap(lambda(tuple(a), (a.1, a.2 / runningDifference(t / 1000))), groupArr)
FROM
(
    SELECT
        t,
        groupArray((OS, c)) AS groupArr
    FROM
    (
        SELECT
            (intDiv(toUInt32(EventTime), 60) * 60) * 1000 AS t,
            OS,
            count(*) AS c
        FROM requests
        WHERE ((EventDate >= toDate(1482796867)) AND (EventDate <= toDate(1482853383))) AND ((EventTime >= toDateTime(1482796867)) AND (EventTime <= toDateTime(1482853383)))
        GROUP BY
            t,
            OS
        ORDER BY
            t,
            OS
    )
    GROUP BY t
    ORDER BY t
)
$rateColumnsAggregated(key, subkey, aggFunction1, value1, ... aggFunctionN, valueN) - 如果您需要计算更高基数维度的 rate,然后按较低基数维度进行聚合
示例用法
$rateColumnsAggregated(datacenter, concat(datacenter,interface) AS dc_interface, sum, tx_bytes * 1014 AS tx_kbytes, sum, max(rx_bytes) AS rx_bytes) FROM traffic
查询将被转换为
SELECT
    t,
    datacenter,
    sum(tx_kbytesRate) AS tx_bytesRateAgg,
    sum(rx_bytesRate) AS rx_bytesRateAgg
FROM
(
    SELECT
        t,
        datacenter,
        dc_interface,
        tx_kbytes / runningDifference(t / 1000) AS tx_kbytesRate,
        rx_bytes / runningDifference(t / 1000) AS rx_bytesRate
    FROM
    (
        SELECT
            (intDiv(toUInt32(event_time), 60) * 60) * 1000 AS t,
            datacenter,
            concat(datacenter,interface) AS dc_interface,
            max(tx_bytes * 1024) AS tx_kbytes,
            max(rx_bytes) AS rx_bytes
        FROM traffic
        WHERE ((event_date >= toDate(1482796867)) AND (event_date <= toDate(1482853383)))
          AND ((event_time >= toDateTime(1482796867)) AND (event_time <= toDateTime(1482853383)))
        GROUP BY
            t,
            datacenter,
            dc_interface
        ORDER BY
            t,
            datacenter,
            dc_interface
    )
)
GROUP BY
  t,
  datacenter
ORDER BY
  datacenter,
  t
请查看issue 386 以了解实现原因
$perSecond(cols...) - 将查询结果转换为 Counter 类型(仅增长)指标的“每间隔变化率”
示例用法
$perSecond(Requests) FROM requests
查询将被转换为
SELECT
    t,
    if(runningDifference(max_0) < 0, nan, runningDifference(max_0) / runningDifference(t / 1000)) AS max_0_PerSecond
FROM
(
    SELECT
        (intDiv(toUInt32(EventTime), 60) * 60) * 1000 AS t,
        max(Requests) AS max_0
    FROM requests
    WHERE ((EventDate >= toDate(1535711819)) AND (EventDate <= toDate(1535714715)))
    AND ((EventTime >= toDateTime(1535711819)) AND (EventTime <= toDateTime(1535714715)))
    GROUP BY t
    ORDER BY t
)
// 请查看issue 78 了解背景信息
$perSecondColumns(key, value) - 是 $columns 和 $perSecond 的组合,用于 Counter 类型指标
示例用法
$perSecondColumns(Protocol, Requests) FROM requests WHERE Protocol in ('udp','tcp')
查询将被转换为
SELECT
    t,
    groupArray((perSecondColumns, max_0_PerSecond)) AS groupArr
FROM
(
    SELECT
        t,
        Protocol,
        if(runningDifference(max_0) < 0 OR neighbor(perSecondColumns,-1,perSecondColumns) != perSecondColumns, nan, runningDifference(max_0) / runningDifference(t / 1000)) AS max_0_PerSecond
    FROM
    (
        SELECT
            (intDiv(toUInt32(EventTime), 60) * 60) * 1000 AS t,
            Protocol AS perSecondColumns,
            max(Requests) AS max_0
        FROM requests
        WHERE ((EventDate >= toDate(1535711819)) AND (EventDate <= toDate(1535714715)))
        AND ((EventTime >= toDateTime(1535711819)) AND (EventTime <= toDateTime(1535714715)))
        AND (Protocol IN ('udp', 'tcp'))
        GROUP BY
            t,
            Protocol
        ORDER BY
            t,
            Protocol
    )
)
GROUP BY t
ORDER BY t
// 请查看issue 80 了解背景信息
$perSecondColumnsAggregated(key, subkey, aggFunction1, value1, ... aggFunctionN, valueN) - 如果您需要计算更高基数维度的 perSecond,然后按较低基数维度进行聚合
示例用法
$perSecondColumnsAggregated(datacenter, concat(datacenter,interface) AS dc_interface, sum, tx_bytes * 1014 AS tx_kbytes, sum, max(rx_bytes) AS rx_bytes) FROM traffic
查询将被转换为
SELECT
    t,
    datacenter,
    sum(tx_kbytesPerSecond) AS tx_bytesPerSecondAgg,
    sum(rx_bytesPerSecond) AS rx_bytesPerSecondAgg
FROM
(
    SELECT
        t,
        datacenter,
        dc_interface,
        if(runningDifference(tx_kbytes) < 0 OR neighbor(tx_kbytes,-1,tx_kbytes) != tx_kbytes, nan, runningDifference(tx_kbytes) / runningDifference(t / 1000)) AS tx_kbytesPerSecond,
        if(runningDifference(rx_bytes) < 0 OR neighbor(rx_bytes,-1,rx_bytes) != rx_bytes, nan, runningDifference(rx_bytes) / runningDifference(t / 1000)) AS rx_bytesPerSecond
    FROM
    (
        SELECT
            (intDiv(toUInt32(event_time), 60) * 60) * 1000 AS t,
            datacenter,
            concat(datacenter,interface) AS dc_interface,
            max(tx_bytes * 1024) AS tx_kbytes,
            max(rx_bytes) AS rx_bytes
        FROM traffic
        WHERE ((event_date >= toDate(1482796867)) AND (event_date <= toDate(1482853383)))
          AND ((event_time >= toDateTime(1482796867)) AND (event_time <= toDateTime(1482853383)))
        GROUP BY
            t,
            datacenter,
            dc_interface
        ORDER BY
            t,
            datacenter,
            dc_interface
    )
)
GROUP BY
  t,
  datacenter
ORDER BY
  datacenter,
  t
请查看issue 386 以了解实现原因
$delta(cols...) - 将查询结果转换为 Counter 类型(仅增长)指标的“间隔内的差值”,如果 Counter 重置则为负值
示例用法
$delta(Requests) FROM requests
查询将被转换为
SELECT
    t,
    runningDifference(max_0) AS max_0_Delta
FROM
(
    SELECT
        (intDiv(toUInt32(EventTime), 60) * 60) * 1000 AS t,
        max(Requests) AS max_0
    FROM requests
    WHERE ((EventDate >= toDate(1535711819)) AND (EventDate <= toDate(1535714715)))
    AND ((EventTime >= toDateTime(1535711819)) AND (EventTime <= toDateTime(1535714715)))
    GROUP BY t
    ORDER BY t
)
// 请查看issue 455 了解背景信息
$deltaColumns(key, value) - 是 $columns 和 $delta 的组合,用于 Counter 类型指标
示例用法
$deltaColumns(Protocol, Requests) FROM requests WHERE Protocol in ('udp','tcp')
查询将被转换为
SELECT
    t,
    groupArray((deltaColumns, max_0_Delta)) AS groupArr
FROM
(
    SELECT
        t,
        deltaColumns,
        if (neighbor(deltaColumns,-1,deltaColumns) != deltaColumns, 0, runningDifference(max_0)) AS max_0_Delta
    FROM
    (
        SELECT
            (intDiv(toUInt32(EventTime), 60) * 60) * 1000 AS t,
            Protocol AS deltaColumns,
            max(Requests) AS max_0
        FROM requests
        WHERE ((EventDate >= toDate(1535711819)) AND (EventDate <= toDate(1535714715)))
        AND ((EventTime >= toDateTime(1535711819)) AND (EventTime <= toDateTime(1535714715)))
        AND (Protocol IN ('udp', 'tcp'))
        GROUP BY
            t,
            Protocol
        ORDER BY
            t,
            Protocol
    )
)
GROUP BY t
ORDER BY t
// 请查看issue 455 了解背景信息
$deltaColumnsAggregated(key, subkey, aggFunction1, value1, ... aggFunctionN, valueN) - 如果您需要计算更高基数维度的 delta,然后按较低基数维度进行聚合
示例用法
$deltaColumnsAggregated(datacenter, concat(datacenter,interface) AS dc_interface, sum, tx_bytes * 1014 AS tx_kbytes, sum, max(rx_bytes) AS rx_bytes) FROM traffic
查询将被转换为
SELECT
    t,
    datacenter,
    sum(tx_kbytesDelta) AS tx_bytesDeltaAgg,
    sum(rx_bytesDelta) AS rx_bytesDeltaAgg
FROM
(
    SELECT
        t,
        datacenter,
        dc_interface,
        if(neighbor(tx_kbytes,-1,tx_kbytes) != tx_kbytes, 0, runningDifference(tx_kbytes) / 1) AS tx_kbytesDelta,
        if(neighbor(rx_bytes,-1,rx_bytes) != rx_bytes, 0, runningDifference(rx_bytes) / 1) AS rx_bytesDelta
    FROM
    (
        SELECT
            (intDiv(toUInt32(event_time), 60) * 60) * 1000 AS t,
            datacenter,
            concat(datacenter,interface) AS dc_interface,
            max(tx_bytes * 1024) AS tx_kbytes,
            max(rx_bytes) AS rx_bytes
        FROM traffic
        WHERE ((event_date >= toDate(1482796867)) AND (event_date <= toDate(1482853383)))
          AND ((event_time >= toDateTime(1482796867)) AND (event_time <= toDateTime(1482853383)))
        GROUP BY
            t,
            datacenter,
            dc_interface
        ORDER BY
            t,
            datacenter,
            dc_interface
    )
)
GROUP BY
  t,
  datacenter
ORDER BY
  datacenter,
  t
请查看issue 386 以了解实现原因
$increase(cols...) - 将查询结果转换为 Counter 类型(仅增长)指标的“间隔内的非负差值”,如果 Counter 重置且差值为负则为零
示例用法
$increase(Requests) FROM requests
查询将被转换为
SELECT
    t,
    if(runningDifference(max_0) < 0, 0, runningDifference(max_0) ) AS max_0_Increase
FROM
(
    SELECT
        (intDiv(toUInt32(EventTime), 60) * 60) * 1000 AS t,
        max(Requests) AS max_0
    FROM requests
    WHERE ((EventDate >= toDate(1535711819)) AND (EventDate <= toDate(1535714715)))
    AND ((EventTime >= toDateTime(1535711819)) AND (EventTime <= toDateTime(1535714715)))
    GROUP BY t
    ORDER BY t
)
// 请查看issue 455 了解背景信息
$increaseColumns(key, value) - 是 $columns 和 $increase 的组合,用于 Counter 类型指标
示例用法
$increaseColumns(Protocol, Requests) FROM requests WHERE Protocol in ('udp','tcp')
查询将被转换为
SELECT
    t,
    groupArray((increaseColumns, max_0_Increase)) AS groupArr
FROM
(
    SELECT
        t,
        Protocol,
        if (runningDifference(max_0) < 0 OR neighbor(increaseColumns,-1,increaseColumns) != increaseColumns, 0, runningDifference(max_0)) AS max_0_Increase
    FROM
    (
        SELECT
            (intDiv(toUInt32(EventTime), 60) * 60) * 1000 AS t,
            Protocol AS increaseColumns,
            max(Requests) AS max_0
        FROM requests
        WHERE ((EventDate >= toDate(1535711819)) AND (EventDate <= toDate(1535714715)))
        AND ((EventTime >= toDateTime(1535711819)) AND (EventTime <= toDateTime(1535714715)))
        AND (Protocol IN ('udp', 'tcp'))
        GROUP BY
            t,
            Protocol
        ORDER BY
            t,
            Protocol
    )
)
GROUP BY t
ORDER BY t
// 请查看issue 455 了解背景信息
$increaseColumnsAggregated(key, subkey, aggFunction1, value1, ... aggFunctionN, valueN) - 如果您需要计算更高基数维度的 increase,然后按较低基数维度进行聚合
示例用法
$increaseColumnsAggregated(datacenter, concat(datacenter,interface) AS dc_interface, sum, tx_bytes * 1014 AS tx_kbytes, sum, max(rx_bytes) AS rx_bytes) FROM traffic
查询将被转换为
SELECT
    t,
    datacenter,
    sum(tx_kbytesIncrease) AS tx_bytesIncreaseAgg,
    sum(rx_bytesIncrease) AS rx_bytesIncreaseAgg
FROM
(
    SELECT
        t,
        datacenter,
        dc_interface,
        if(runningDifference(tx_kbytes) < 0 OR neighbor(tx_kbytes,-1,tx_kbytes) != tx_kbytes, nan, runningDifference(tx_kbytes) / 1) AS tx_kbytesIncrease,
        if(runningDifference(rx_bytes) < 0 OR neighbor(rx_bytes,-1,rx_bytes) != rx_bytes, nan, runningDifference(rx_bytes) / 1) AS rx_bytesIncrease
    FROM
    (
        SELECT
            (intDiv(toUInt32(event_time), 60) * 60) * 1000 AS t,
            datacenter,
            concat(datacenter,interface) AS dc_interface,
            max(tx_bytes * 1024) AS tx_kbytes,
            max(rx_bytes) AS rx_bytes
        FROM traffic
        WHERE ((event_date >= toDate(1482796867)) AND (event_date <= toDate(1482853383)))
          AND ((event_time >= toDateTime(1482796867)) AND (event_time <= toDateTime(1482853383)))
        GROUP BY
            t,
            datacenter,
            dc_interface
        ORDER BY
            t,
            datacenter,
            dc_interface
    )
)
GROUP BY
  t,
  datacenter
ORDER BY
  datacenter,
  t
请查看issue 386 以了解实现原因
模板变量
查询变量
如果您添加类型为 Query 的模板变量,您可以编写 ClickHouse 查询,返回例如测量名称、键名称或键值等内容,这些内容将显示为下拉选择框。
例如,如果在模板变量的 Query 设置中指定如下查询,您可以获得一个包含表中 hostname 列所有值的变量。
SELECT hostname FROM host
要在查询中使用依赖于时间范围的宏,例如 timeFilterByColumn($column),模板变量的刷新模式需要设置为 On Time Range Change。
SELECT event_name FROM event_log WHERE $timeFilterByColumn(time_column)
另一种选择是创建一个键/值变量的查询。该查询应返回名为 __text 和 __value 的两列。__text 列的值应该是唯一的(如果不唯一则使用第一个值)。下拉选项将包含文本和值,允许您使用友好的名称作为文本,使用 ID 作为值。以下是一个示例查询,其中 hostname 作为文本,id 作为值
SELECT hostname AS __text, id AS __value FROM host
您还可以创建嵌套变量。例如,如果您有另一个名为 region 的变量。然后,您可以使用如下查询,使 hosts 变量仅显示当前选定区域的主机(如果 region 是一个多值变量,则使用 IN 比较运算符而不是 = 来匹配多个值)
SELECT hostname FROM host WHERE region IN ($region)
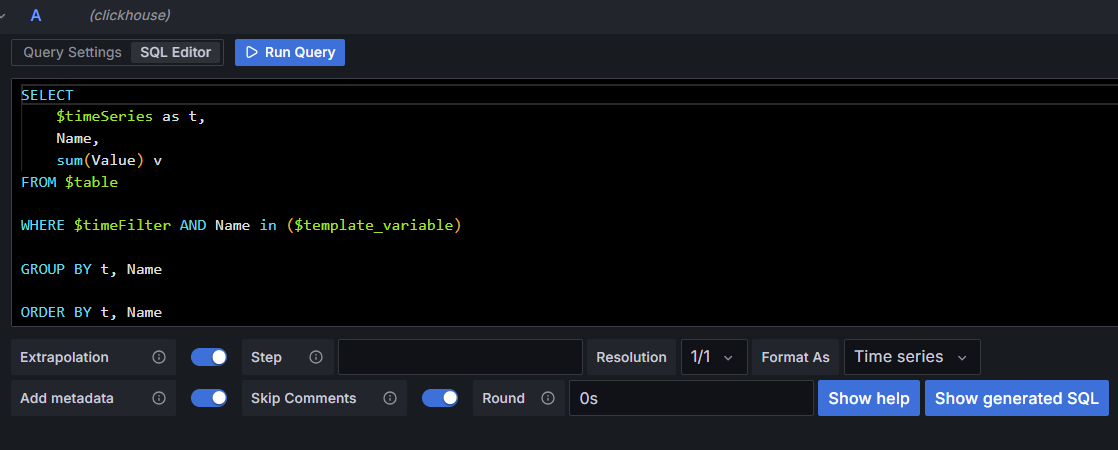
条件谓词
如果您使用模板变量为谓词提供数据,当所有内容都被选为谓词时,您将面临性能下降,而且这是不必要的。对于未输入任何内容的文本框也是如此,您必须编写特定的 SQL 代码来处理。
为了解决这个问题,可以使用新的宏 $conditionalTest(SQL Predicate,$variable) 来移除查询的一部分。如果变量是类型为 query 并选中了“All”,或者变量是未输入任何内容的文本框,则生成的查询中不包含 SQL Predicate。
举个例子:有 2 个变量 $var (带 Include All 选项的查询变量) $text (文本框) $text_with_single_quote (带单引号的文本框)
以下查询
 SELECT
   $timeSeries as t,
   count()
   FROM $table
   WHERE $timeFilter
    $conditionalTest(AND toLowerCase(column) in ($var),$var)
    $conditionalTest(AND toLowerCase(column2) like '%$text%',$text)
    $conditionalTest(AND toLowerCase(column3) ilike ${text_with_single_quote:sqlstring},$text_with_single_quote)
   GROUP BY t
   ORDER BY t
如果 $var 选择了“All”值,并且 $text 变量为空,查询将转换为
  SELECT
    $timeSeries as t,
    count()
     FROM $table
     WHERE $timeFilter
   GROUP BY t
   ORDER BY t
如果 $var 模板变量选择了一些元素,并且 $text 模板变量至少有一个字符,查询将转换为
SELECT
    $timeSeries as t,
    count()
     FROM $table
     WHERE $timeFilter
   AND toLowerCase(column) in ($var)
   AND toLowerCase(column2) like '%$text%'
   GROUP BY t
   ORDER BY t
使用面板
饼状图 (https://grafana.org.cn/plugins/grafana-piechart-panel)
请记住,饼状图插件在 Grafana 中不被推荐使用 - 请参阅Grafana 博客 - Friends don't let friends abuse pie charts

要创建“Top 5”图表,我们需要两个查询:一个用于“Top 5”行,一个用于“Other”行。
Top 5
SELECT
    1 AS t, /* fake timestamp value */
    UserName,
    sum(Requests) AS Reqs
FROM requests
GROUP BY t, UserName
ORDER BY Reqs DESC
LIMIT 5
Other
SELECT
    1 AS t, /* fake timestamp value */
    UserName,
    sum(Requests) AS Reqs
FROM requests
GROUP BY t, UserName
ORDER BY Reqs DESC
LIMIT 5,10000000000000 /* select some ridiculous number after first 5 */
表格视图 (https://grafana.org.cn/plugins/table)
显示时间序列数据没有任何技巧。要打印汇总数据,请忽略时间列,将结果格式化为“Table”并点击“Run query”。
SELECT
    UserName,
    sum(Requests) as Reqs
FROM requests
GROUP BY
    UserName
ORDER BY
    Reqs

垂直直方图 (https://grafana.org.cn/plugins/graph)

要从 Graph 面板制作垂直直方图,我们需要编辑一些设置
- Display -> Draw Modes -> Bars
- Axes -> X-Axis -> Mode -> Series
您可以使用以下查询
$columns(
    Size,
    sum(Items) Items)
FROM some_table
// 也可以使用不带宏的查询
世界地图面板 (https://github.com/grafana/worldmap-panel)

如果您有包含国家/城市代码的表
SELECT
    1,
    Country AS c,
    sum(Requests) AS Reqs
FROM requests
GLOBAL ANY INNER JOIN
(
    SELECT Country, CountryCode
    FROM countries
) USING (CountryCode)
WHERE $timeFilter
GROUP BY
    c
ORDER BY Reqs DESC
如果您使用 geohash,请设置以下选项

您可以使用 Table 格式进行以下查询

即席过滤器
如果存在即席变量,插件将抓取所有数据库(系统数据库除外)中所有表的所有列作为标签。因此下拉菜单中将有 database.table.column 格式的选项。如果您指定默认数据库,它将仅抓取该数据库中的表和列,下拉菜单将有 table.column 格式的选项。如果存在 ENUM 列,插件将抓取其选项并将其用作标签值。此外,插件将为其他类型字段抓取 300 个唯一值。
如果仪表盘上的查询设置中的 $database 和 $table 与即席控件中指定的 database.table 相同,插件将对该仪表盘上的所有查询应用即席过滤器。如果即席过滤器未指定表,它将应用于所有查询,无论表是什么。这对于包含对多个不同表进行查询的仪表盘很有用。

对于多个即席过滤器,没有选项可以应用 OR 运算符 - 请参阅 grafana/grafana#10918 由于 Grafana 的限制,即席过滤器无法使用 IN 运算符
有时 CH 可能包含太多表和列,导致获取它们耗时较长。因此,如果您需要使用不同数据库的多个仪表盘,使用默认数据库将无济于事。解决此问题的最佳方法是在仪表盘设置中使用参数化的即席变量。目前 Grafana 界面尚不支持此功能(请参阅issue)。作为临时解决方案,插件将尝试查找名为 adhoc_query_filter 的变量,如果存在,将使用其值作为查询来获取列。为此,我们建议创建一个名为 adhoc_query_filter 的常量变量,并设置类似于以下的值
SELECT database, table, name, type FROM system.columns WHERE table='myTable' ORDER BY database, table
这应该有助于控制即席查询的数据获取。
通过查询获取模板变量值
要在查询中使用依赖于时间范围的宏,例如 $from 和 $to,模板变量的刷新模式需要设置为 On Time Range Change。
SELECT ClientID FROM events WHERE EventTime > toDateTime($from) AND EventTime < toDateTime($to)
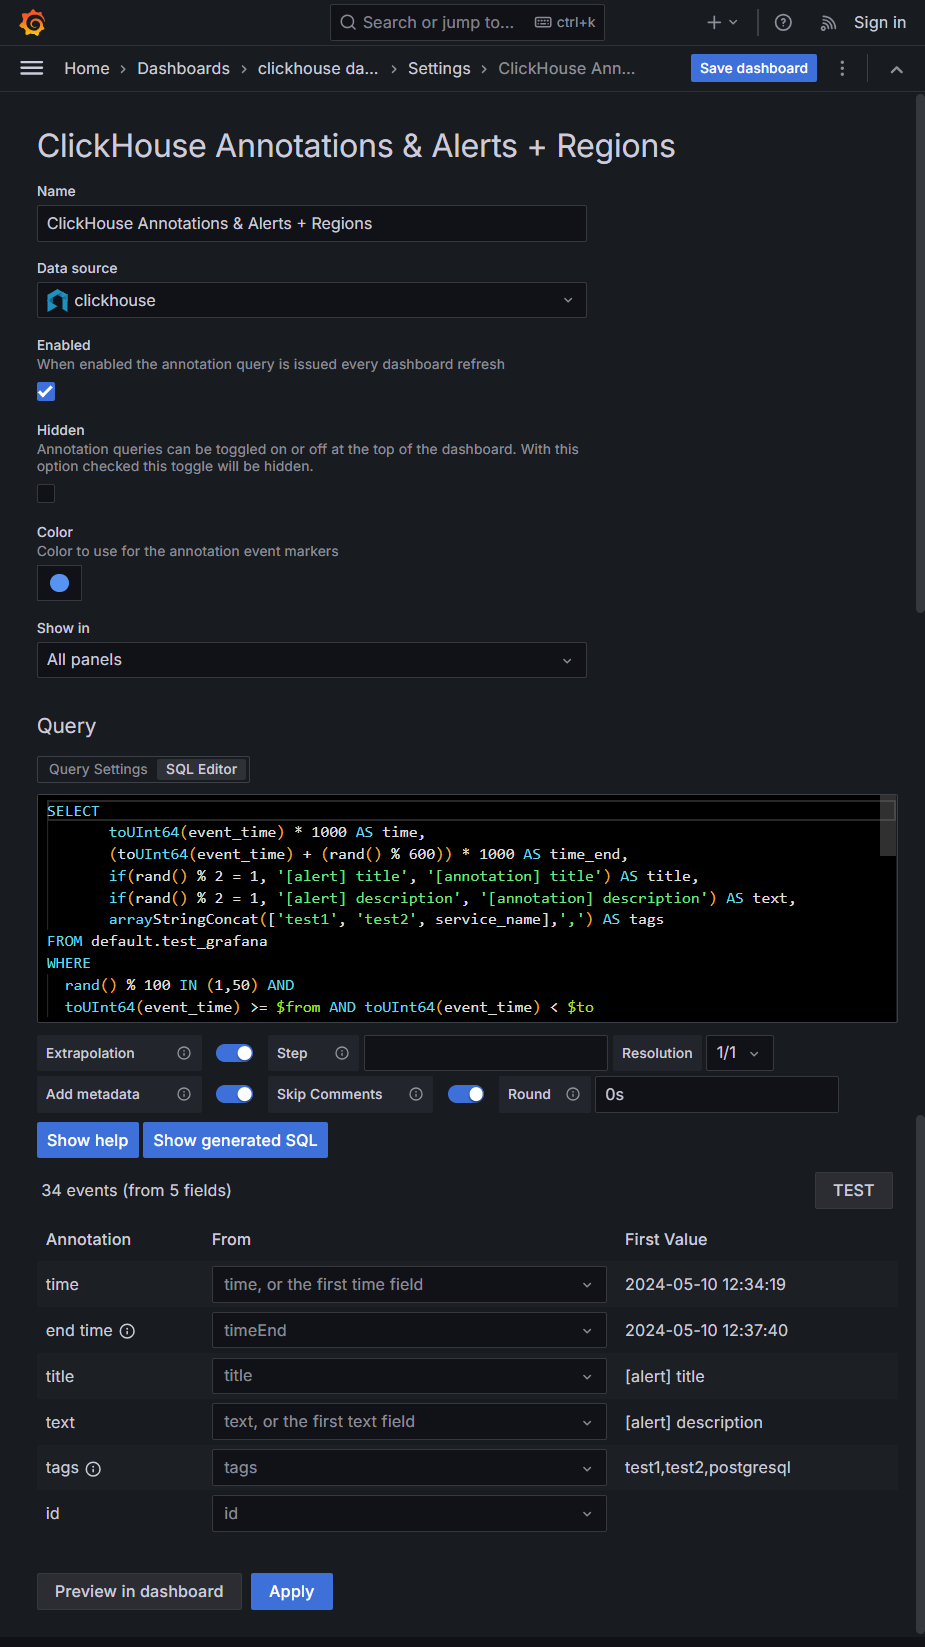
注解
插件支持带区域的注解。要启用此功能,请打开仪表盘 settings,使用 clickhouse 数据源添加新的注解查询,并使用正确的字段名称。


告警支持
Grafana 提供两种告警。统一告警和 Graph 面板相关告警(遗留)。我们的插件支持这两种告警,但不能同时使用。请使用 GF_UNIFIED_ALERTING_ENABLED=1(推荐)或 GF_ALERTING_ENABLED=1 环境变量进行切换。
面板相关告警(遗留)
要启用告警,请打开面板中的“告警”选项卡,并按照 grafana.com 上的描述定义告警表达式

请注意模板变量的值,目前 grafana 本身不支持告警查询中的模板变量。此外,grafana UI 在您更改前端 UI 后,不会将模板变量值传递给后端。
因此,clickhouse grafana 插件可以使用模板变量值,因为我们有“Generated SQL”,它会“原样”传递给后端。为确保模板变量值能正确传递到插件的后端部分,请在 UI 下拉菜单中选择告警所需的模板变量值,确保这些值在“Generated SQL”中正确渲染(可能需要在查询编辑器中更改 SQL 查询),然后将整个仪表盘保存到 Grafana 服务器。
警告:Test alert 按钮不会将告警规则的当前状态保存到插件的后端部分。
如果“Generated SQL”正确传递到插件的后端部分,您将看到如下内容:
统一告警支持
统一告警可以通过 YAML 文件进行 Provisioning,请查看 https://github.com/Altinity/clickhouse-grafana/tree/master/docker/grafana/provisioning/alerting/


要将现有的统一告警导出到 YAML,请使用导出告警

告警故障排除
要在 clickhouse grafana 插件中排查告警问题时,请在 grafana.ini 的 log 部分或通过 GF_LOG_LEVEL=debug 环境变量启用 level=debug。
直方图支持

要显示直方图,您需要使用“时间序列”格式的查询
根据 https://grafana.org.cn/docs/grafana/latest/panels-visualizations/visualizations/histogram,直方图支持时间序列以及包含一个或多个数值字段的任何表格结果。
日志支持
要将您的 ClickHouse 数据渲染为日志,请在 Query Editor 的“Format as”下拉菜单中使用名为“Logs”的特殊格式。此选项有助于 Grafana 将数据识别为日志,并在 Explore UI 中自动显示日志可视化。在仪表盘上,您也可以使用Logs 面板。

要返回适合日志的数据,查询应至少返回 ClickHouse 中的一个时间字段(假定为第一个字段)和一个文本字段。
插件还将除了日志行之外的所有文本字段根据以下规则转换为标签
- 日志行将从专用的
content字段或结果中按顺序排列的第一个文本字段中获取 - 所有其他文本字段将被视为标签
Grafana 可以识别一些专用字段
level(字符串) - 为每行日志设置级别id(字符串) - 默认情况下,Grafana 提供基本的日志行去重支持,通过添加此字段可以明确为每行日志分配标识符来改进
数据源返回的所有其他字段将被 Grafana 识别为检测到的字段
火焰图支持

要显示追踪,您需要使用“火焰图”格式的查询 根据 https://grafana.org.cn/docs/grafana/latest/panels-visualizations/visualizations/flame-graph/#data-api,您需要一个包含 4 个字段的记录集
level- 数字 - 堆栈帧的级别。根帧的级别为 0。label- 字符串 - 函数名称或其他识别符号value- 数字 - 此堆栈追踪中记录的样本或字节数self- 数字 - 仅在此堆栈帧中记录(不包括子级)的样本或字节数,对于 ClickHouse 而言通常为零,因为我们无法计算)
此外,行应按堆栈追踪和级别排序
如果您在 profile 或 query 级别设置中配置了 query_profiler_real_time_period_ns,则可以使用以下查询将其可视化为火焰图
请参阅system.trace_log 表描述以了解如何获取火焰图数据 请参阅火焰图仪表盘示例 以查看带有火焰图的仪表盘示例
火焰图查询示例
SELECT length(trace)  - level_num AS level, label, count() AS value, 0 self
FROM system.trace_log
  ARRAY JOIN arrayEnumerate(trace) AS level_num,
  arrayMap(x -> if(addressToSymbol(x) != '', demangle(addressToSymbol(x)), 'unknown') , trace) AS label
WHERE trace_type='Real' AND $timeFilter
GROUP BY level, label, trace
ORDER BY trace, level
追踪支持
要显示追踪,您需要使用“追踪”格式的查询,并按照以下 

例如,如果在用户 profile 中 <opentelemetry_start_trace_probability>1</opentelemetry_start_trace_probability> 并且 system.opentelemetry_span_log 不为空,则可以显示关于 ClickHouse 查询执行的追踪 请参阅system.opentelemetry_span_log 表描述以了解如何获取火焰图数据 请参阅追踪仪表盘示例 以查看带有火焰图的仪表盘示例
追踪可视化需要以下字段名称(区分大小写)
traceID- 字符串spanID- 字符串operationName- 字符串parentSpanID- 字符串serviceName- 字符串duration- UInt64 - 持续时间(毫秒)startTime- UInt64 - 开始时间(毫秒)tags- map(String, String) - span 标签serviceTags- map(String, String) - 服务标签(例如 'hostName')
system.opentelemetry_span_log 的追踪查询示例
SELECT
  trace_id AS traceID,
  span_id AS spanID,
  operation_name AS operationName,
  parent_span_id AS parentSpanID,
  'clickhouse' AS serviceName,
  intDiv(finish_time_us - start_time_us, 1000) AS duration,
  intDiv(start_time_us,1000) AS startTime,
  attribute AS tags,
  map('hostName',hostname) AS serviceTags
FROM
  system.opentelemetry_span_log
WHERE $timeFilter
ORDER BY traceID, startTime
使用 Provisioning 配置数据源
现在可以使用配置文件和 Grafana 的 Provisioning 系统来配置数据源。您可以在Provisioning 文档页面了解其工作原理以及可以为数据源设置的所有设置。
以下是一些 Provisioning 示例
apiVersion: 1
datasources:
name: Clickhouse type: vertamedia-clickhouse-datasource access: proxy url: https://:8123<bool> enable/disable basic auth
basicAuth: false<string> basic auth username
basicAuthUser: “default”<bool> enable/disable with credentials headers
withCredentials: false<bool> mark as default datasource. Max one per org
isDefault: false<map> fields that will be converted to json and stored in json_data
jsonData:<bool> enable/disable sending ‘add_http_cors_header=1’ parameter
addCorsHeader: false<bool> enable/disable using POST method for sending queries
usePOST: false<bool> enable/disable using Accept-Encoding header in each request
useCompression: false<string> compression type allowed values: gzip, zstd, br, deflate
compressionType: ""<string> default database name
defaultDatabase: ""<bool> enable/disable tls authorization
tlsAuth: false<bool> enable/disable tls authorization with custom ca
tlsAuthWithCACert: false<bool> enable/disable authorization with X-ClickHouse-* headers
useYandexCloudAuthorization: false<string> X-ClickHouse-Key header value for authorization
xHeaderUser: ""<string> the same value as url when
useYandexCloudAuthorization: true@todo remove this workaround when merge https://github.com/grafana/grafana/pull/80858
dataSourceUrl: “https://:8123” secureJsonData:<string> X-ClickHouse-User header value for authorization
xHeaderKey: ""<string> basic auth password
basicAuthPassword: ""<string> custom certificate authority for TLS https connection, base64 encoded
tlsCACert: ""<string> custom client certificate for TLS https connection, base64 encoded
tlsClientCert: ""<string> custom client secret key for TLS https connection, base64 encoded
tlsClientKey: ""
某些设置和安全参数对所有数据源都是相同的。您可以在此处找到它们。
常见问题
为什么时间序列的最后一个点不是真实的最后一个点?
如果时间范围是“最近 N”,插件会外推最后一个数据点,以避免当表中时间戳四舍五入到分钟或更大时,图表不断下降。在这种情况下,99% 的最后一个数据点会远小于前一个,因为最后一分钟尚未结束。因此,插件会检查之前的数据点,并尝试预测最后一个数据点的值,就像它已经写入数据库一样。此行为可以通过查询编辑器中的“Extrapolation”复选框关闭。
SQL 查询示例中使用了哪种表 schema?
此插件中的所有示例均使用以下表 schema
CREATE TABLE IF NOT EXISTS countries( Country LowCardinality(String), CountryCode LowCardinality(String) ) ENGINE MergeTree() ORDER BY (CountryCode, Country);CREATE TABLE IF NOT EXISTS oses ( OSName LowCardinality(String), OS LowCardinality(String) ) ENGINE MergeTree() ORDER BY (OS);
CREATE TABLE IF NOT EXISTS requests( EventTime DateTime, EventDate Date, Protocol LowCardinality(String), UserName LowCardinality(String), OS LowCardinality(String), CountryCode LowCardinality(String), Type UInt8, Requests UInt32 ) ENGINE=MergeTree() ORDER BY (EventDate, EventTime, Type, OS, Protocol, UserName) PARTITION BY toYYYYMM(EventDate);
告警支持如何?
告警功能需要在 Grafana 的后端进行更改,这仅适用于 Grafana 6.5+。Grafana 的维护者正在开发此功能。clickhouse-grafana 数据源插件当前的告警支持处于测试阶段。
对于 ClickHouse Grafana 插件 2.2.3+ 版本,仅支持 Linux、macOS、Windows 的 amd64 架构以及 Linux、macOS (m1) 的 arm64 架构。2.2.3 版本之前仅支持 amd64。
贡献
如果您有任何改进的想法或发现了 bug,请随时提交 issue 或 pull request。我们非常感谢社区提供的任何帮助,这将使使用 ClickHouse 和 Grafana 等出色产品变得更加便捷。
开发
请参阅CONTRIBUTING.md 获取开发和 pull request 贡献说明
许可证
MIT 许可证,详情请参阅LICENSE。
在 Grafana Cloud 上安装 Altinity ClickHouse 插件
在 Grafana Cloud 实例上安装插件是一键式的;更新也是如此。很酷,对吧?
请注意,插件可能需要最多 1 分钟才能在您的 Grafana 中显示。
在 Grafana Cloud 实例上安装插件是一键式的;更新也是如此。很酷,对吧?
请注意,插件可能需要最多 1 分钟才能在您的 Grafana 中显示。
在 Grafana Cloud 实例上安装插件是一键式的;更新也是如此。很酷,对吧?
请注意,插件可能需要最多 1 分钟才能在您的 Grafana 中显示。
在 Grafana Cloud 实例上安装插件是一键式的;更新也是如此。很酷,对吧?
请注意,插件可能需要最多 1 分钟才能在您的 Grafana 中显示。
在 Grafana Cloud 实例上安装插件是一键式的;更新也是如此。很酷,对吧?
请注意,插件可能需要最多 1 分钟才能在您的 Grafana 中显示。
在 Grafana Cloud 实例上安装插件是一键式的;更新也是如此。很酷,对吧?
请注意,插件可能需要最多 1 分钟才能在您的 Grafana 中显示。
在 Grafana Cloud 实例上安装插件是一键式的;更新也是如此。很酷,对吧?
请注意,插件可能需要最多 1 分钟才能在您的 Grafana 中显示。
有关更多信息,请访问关于插件安装的文档。
在本地 Grafana 上安装
对于本地实例,插件通过简单的 CLI 命令安装和更新。插件不会自动更新,但当有更新可用时,您会在 Grafana 中收到通知。
1. 安装数据源
使用 grafana-cli 工具从命令行安装 Altinity ClickHouse 插件
grafana-cli plugins install 插件将安装到您的 Grafana 插件目录;默认路径为 /var/lib/grafana/plugins。关于 CLI 工具的更多信息。
2. 配置数据源
从 Grafana 主菜单访问,新安装的数据源可以在“Data Sources”部分立即添加。
接下来,点击右上角的“添加数据源”按钮。数据源将在“类型”选择框中可用。
要查看已安装的数据源列表,请点击主菜单中的“插件”项。核心数据源和已安装的数据源都将显示。
3.3.1 (2024-12-27)
改进
- 添加使用窗口函数代替宏中的
runningDifference和neighbor,以避免allow_deprecated_error_prone_window_functions,修复 https://github.com/Altinity/clickhouse-grafana/issues/572 - 添加公开覆盖率报告摘要,修复 https://github.com/Altinity/clickhouse-grafana/issues/660
- 为注解查询添加
DateTime(timezone)类型支持,修复 https://github.com/Altinity/clickhouse-grafana/issues/642 - 添加带类别的 SingleStat 面板,修复 https://github.com/Altinity/clickhouse-grafana/issues/403
- 在连接设置中添加日志上下文窗口大小,修复 https://github.com/Altinity/clickhouse-grafana/issues/657
- 添加
X-ClickHouse-SSL-Certificate-Auth支持,修复 https://github.com/Altinity/clickhouse-grafana/issues/580 - 添加
$columnsMs宏,修复 https://github.com/Altinity/clickhouse-grafana/issues/430 - 添加即席隐藏表名连接设置选项,修复 https://github.com/Altinity/clickhouse-grafana/issues/456
修复
- 添加转置表示例,修复 https://github.com/Altinity/clickhouse-grafana/issues/404
- 添加“按原样显示 DateTime”仪表盘,以避免在浏览器时区显示 DateTime 字段,修复 https://github.com/Altinity/clickhouse-grafana/issues/450
- 重构日志可视化,添加“从查询结果配置”转换,修复 https://github.com/Altinity/clickhouse-grafana/issues/449
- 重构即席过滤器,添加连接选项以允许从字段名中隐藏表名,修复 https://github.com/Altinity/clickhouse-grafana/issues/456
- 在 Grafana 11.x 中检查了工具提示可视化,修复 https://github.com/Altinity/clickhouse-grafana/issues/478
3.3.0 (2024-12-02)
改进
- 为日志面板标签添加动态过滤器,修复 https://github.com/Altinity/clickhouse-grafana/issues/487, https://github.com/Altinity/clickhouse-grafana/issues/672
- 允许更改即席查询的 SQL 以选择值,默认查询对于通用用例可能很慢,取决于数据,修复 https://github.com/Altinity/clickhouse-grafana/issues/330
- 允许在 Query Editor 中更改日志面板的日志上下文窗口大小,修复 https://github.com/Altinity/clickhouse-grafana/issues/652
- 添加覆盖率报告,当前行覆盖率约为 80%,修复 https://github.com/Altinity/clickhouse-grafana/pull/663
- 将日志上下文窗口大小添加到连接设置的默认值中,修复 https://github.com/Altinity/clickhouse-grafana/pull/670
- 在生成的 SQL 区域添加复制按钮,修复 https://github.com/Altinity/clickhouse-grafana/issues/659
- 添加对 float 和 timestamp64(X) 时间戳的支持,修复 https://github.com/Altinity/clickhouse-grafana/issues/626, 修复 https://github.com/Altinity/clickhouse-grafana/issues/371
- 解决安全 dependabot 告警,移除未使用的 cypress/e2e 测试
修复
- 外推在 NaN 上正常工作
- e2e 测试覆盖更多用例
3.2.4 (2024-10-28)
改进
- 实现了在告警中支持自定义 HTTP 头,修复 https://github.com/Altinity/clickhouse-grafana/issues/483,感谢 @addshore
- 改进日志支持,添加日志上下文和日志即席过滤器,修复 https://github.com/Altinity/clickhouse-grafana/issues/646
- 改进对 DateTime(timezone) 的支持,使其更一致,修复 https://github.com/Altinity/clickhouse-grafana/issues/625
- 切换到 go 1.23
- 为统一和遗留告警添加更多 e2e 测试
- 使 e2e 测试更稳定
修复
- 修复 AST 解析中的边界情况,以正确计算开闭括号,修复 https://github.com/Altinity/clickhouse-grafana/issues/648
- 修复连接设置中的 bug,当开启
默认值时,基本认证(BasicAuth)下的“默认字段值”下拉选择器不起作用,修复 https://github.com/Altinity/clickhouse-grafana/issues/624, https://github.com/Altinity/clickhouse-grafana/issues/632 - 修复连接设置中的 bug,当开启
默认值时,“默认字段值”下拉框不显示 DateTime64 字段,修复 https://github.com/Altinity/clickhouse-grafana/issues/630
3.2.3 (2024-09-03)
修复
- 修复连接编辑器中更改字段时默认值的行为,同时更改 URL,修复 https://github.com/Altinity/clickhouse-grafana/issues/615
3.2.2 (2024-08-11)
改进
- 改进端到端 (e2e) 测试,覆盖更多场景
- 如果查询已填写,则切换到查询编辑器 (Query Editor) 而非查询设置 (Query Settings),修复 https://github.com/Altinity/clickhouse-grafana/issues/605
修复
- 从即时 (adhoc) system.columns 下拉查询中移除
information_schema - 修复连接设置对话框中
使用默认值选项相关的问题,修复 https://github.com/Altinity/clickhouse-grafana/issues/600 - 修复编辑多个查询面板时查询重置错误的问题,修复 https://github.com/Altinity/clickhouse-grafana/issues/604
- 正确处理状态码为 502 的空响应,修复 https://github.com/Altinity/clickhouse-grafana/issues/595
3.2.1 (2024-06-25)
修复
- 修复自定义 GROUP BY 子句时时间序列转换错误的问题,修复 https://github.com/Altinity/clickhouse-grafana/issues/583
3.2.0 (2024-06-24)
改进
- 在连接属性中添加设置查询构建器默认值的功能,以避免不必要的重复 UI 操作,修复 https://github.com/Altinity/clickhouse-grafana/issues/495
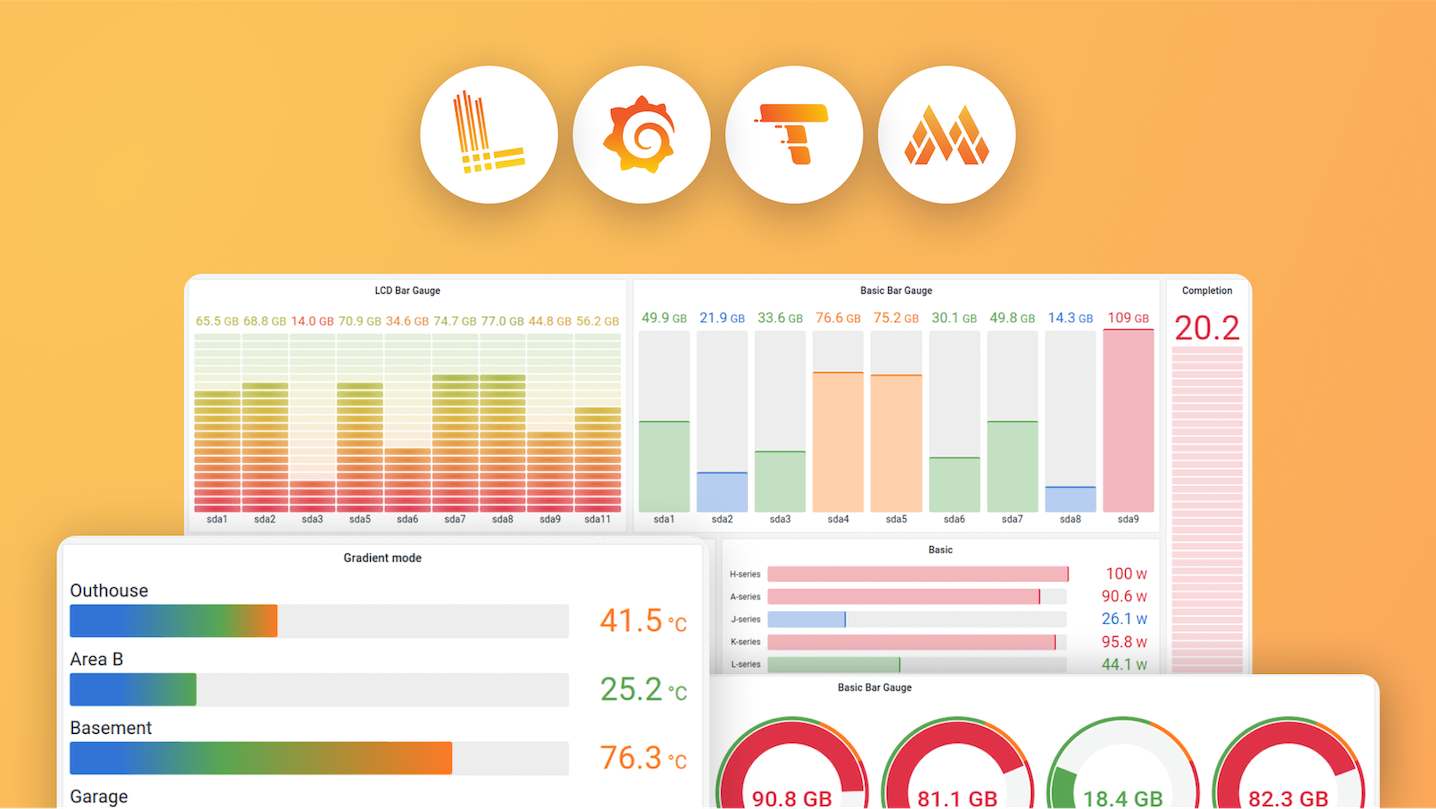
- 为柱状图支持添加示例仪表盘,修复 https://github.com/Altinity/clickhouse-grafana/issues/497
- 为 Map 和 JSON ClickHouse 类型添加正确的可视化支持,修复 https://github.com/Altinity/clickhouse-grafana/issues/486 和 https://github.com/Altinity/clickhouse-grafana/issues/189
- 添加覆盖基本正常路径场景的端到端 (e2e) 测试
修复
- 修复在探索模式下编辑查询后时间范围重置错误的问题,修复 https://github.com/Altinity/clickhouse-grafana/issues/566
- 修复 $columns + 子查询的错误行为,修复 https://github.com/Altinity/clickhouse-grafana/issues/565
3.1.1 (2024-05-20)
修复
- 修复插件 Golang 部分的编码消息错误
- 修复 plugin.json 中截图引用错误的问题
- 修复告警查询编辑器行为错误的问题,修复 https://github.com/Altinity/clickhouse-grafana/issues/560 (影响版本 3.1.0)
- 修复自动完成项 SQL 查询失败时的语法高亮问题,修复 https://github.com/Altinity/clickhouse-grafana/issues/559
- 修复数据源更改时下拉字段值清空的问题 https://github.com/Altinity/clickhouse-grafana/issues/561
3.1.0 (2024-05-10)
改进
- 添加与
clickhouse-client相同的额外自动完成函数,修复 https://github.com/Altinity/clickhouse-grafana/issues/509 - 添加对火焰图 (Flamegraph) 和追踪 (Tracing) 的支持,修复 https://github.com/Altinity/clickhouse-grafana/issues/508
- 增强了对注解查询构建器 (Annotations Query builder) 的支持。
- 在连接设置中添加了对 HTTP 压缩的支持,修复 https://github.com/Altinity/clickhouse-grafana/issues/494
- 切换到 go 1.22
- 更新 README,包含 Grafana 10 的截图
- 添加 $rateColumnsAggregated, $perSecondsColumnsAggregated, $increaseColumnsAggregated, $deltaColumnsAggregated 宏,用于按秒聚合速率 - 修复 https://github.com/Altinity/clickhouse-grafana/issues/386
- 添加
添加元数据选项,该选项添加 SQL 注释以允许在 ClickHouse 服务端检测查询的来源是哪个仪表盘和用户,修复 https://github.com/Altinity/clickhouse-grafana/issues/435
修复
- 修复对 grafana cloud 的支持,修复 https://github.com/Altinity/clickhouse-grafana/issues/517, 修复 https://github.com/Altinity/clickhouse-grafana/issues/516
- QueryEditor 组件的多个 UI 修复,修复 https://github.com/Altinity/clickhouse-grafana/issues/551, https://github.com/Altinity/clickhouse-grafana/issues/546, https://github.com/Altinity/clickhouse-grafana/issues/555, https://github.com/Altinity/clickhouse-grafana/issues/547, https://github.com/Altinity/clickhouse-grafana/issues/540, https://github.com/Altinity/clickhouse-grafana/issues/542,
- 修复当 tlsCARoot 或 tlsClientCert 和 tlsClientKey 为空时 tlsSkipVerify 被忽略的问题,修复 https://github.com/Altinity/clickhouse-grafana/issues/532
- 修复格式为
As table时的多个问题,修复 https://github.com/Altinity/clickhouse-grafana/issues/515, https://github.com/Altinity/clickhouse-grafana/issues/529 - 修复注解设置页面不包含查询文本字段的问题,修复 https://github.com/Altinity/clickhouse-grafana/issues/518
- 重构客户端宏和整个查询的处理方式,修复 https://github.com/Altinity/clickhouse-grafana/issues/524
- 修复在查询中使用 $from 和 $to 宏时的旧版告警问题,修复 https://github.com/Altinity/clickhouse-grafana/issues/458
- 修复 WHERE field IN ('value1','value2') 与 WHERE field IN ['value1','value2'] 的边界情况,修复 https://github.com/Altinity/clickhouse-grafana/issues/506
- 修复 $conditionalTest 宏的边界情况,修复 https://github.com/Altinity/clickhouse-grafana/issues/524
3.0.0 (2024-01-19)
改进
- 从头重写插件,以使用 react 代替 angular 兼容 Grafana 10+
- 如果您从 YAML 配置数据源,现在
xHeaderKey已从jsonData移至secureJsonData,并且您需要将dataSourceUrl添加到jsonData,详情请参阅 https://github.com/Altinity/clickhouse-grafana/issues/348 和docker/grafana/provisioning/datasources/clickhouse-x-auth.yaml
2.5.4 (2023-09-13)
改进
- 切换到 go 1.21
修复
- 修复 $conditionalTest 宏在下拉模板变量没有
All value、有Multi value且选择了零值时的行为问题,修复 https://github.com/Altinity/clickhouse-grafana/issues/485 - 修复 ACE 查询编辑器中的一些函数描述
2.5.3 (2022-11-22)
改进
- 在 README 中添加数据源的 secureJsonData 描述,修复 https://github.com/Altinity/clickhouse-grafana/issues/452
- 添加 $delta, $deltaColumns, $increase, $increaseColumns,修复 https://github.com/Altinity/clickhouse-grafana/issues/455
修复
- 构建插件时添加 CGO_ENABLED=0,修复 https://github.com/Altinity/clickhouse-grafana/issues/447
2.5.2 (2022-09-05)
改进
- 添加节点图 (Node graph) 示例,修复 https://github.com/Altinity/clickhouse-grafana/issues/352
修复
- 在客户端正确转义数据库和表标识符,修复 https://github.com/Altinity/clickhouse-grafana/issues/440,添加更多测试
2.5.1 (2022-08-24)
改进
- 切换到 go1.19,更新 go 包依赖
修复
- 正确转义数据库和表标识符,修复 https://github.com/Altinity/clickhouse-grafana/issues/440
2.5.0 (2022-05-31)
改进
- 添加日志可视化支持,修复 https://github.com/Altinity/clickhouse-grafana/issues/331,感谢 @Fiery-Fenix 和 @pixelsquared
- 将 $conditionalTest 添加到编辑器自动完成
- 为模板变量查询添加 $__searchFilter 支持,修复 https://github.com/Altinity/clickhouse-grafana/issues/354
- 添加支持亚秒级时间分辨率,支持 $timeSeriesMs 和 $timeFilterMs,修复 https://github.com/Altinity/clickhouse-grafana/issues/344, 修复 https://github.com/Altinity/clickhouse-grafana/issues/398
- 打开上下文菜单
Explore时展开模板变量值,修复 https://github.com/Altinity/clickhouse-grafana/issues/346
修复
- 移除 dist 文件夹中的旧版二进制文件,修复 https://github.com/Altinity/clickhouse-grafana/issues/419
- 允许后端部分告警标签名称中使用 Nullable 类型,修复 https://github.com/Altinity/clickhouse-grafana/issues/405
- 从即时控制中移除 INFORMATION_SCHEMA,修复 https://github.com/Altinity/clickhouse-grafana/issues/426
- 在 2.4.4 版本发布后,dist 文件夹中的旧版二进制文件插件名称已更改,修复 https://github.com/Altinity/clickhouse-grafana/issues/419
- 解决
SELECT x IN (SELECT ...)的边界情况,修复 https://github.com/Altinity/clickhouse-grafana/issues/421 - 测试了使用
${variable:sqlstring}格式的文本框变量,修复 https://github.com/Altinity/clickhouse-grafana/issues/125
2.4.4 (2022-04-01)
修复
- 替换 Vertamedia Altinity logo
2.4.3 (2022-03-02)
修复
- 将 ClickHouse logo 更改为 Altinity logo
2.4.2 (2021-12-29)
修复
- 修复统一告警间隔 https://github.com/Altinity/clickhouse-grafana/issues/400
2.4.1 (2021-12-20)
改进
- 更新依赖,尝试修复关键的 nodejs 依赖问题
修复
- 修复后端部分不必要的警告日志消息
- 修复 https://github.com/Altinity/clickhouse-grafana/issues/366
- 修复 https://github.com/Altinity/clickhouse-grafana/issues/357
- 修复 https://github.com/Altinity/clickhouse-grafana/issues/345
- 修复 https://github.com/Altinity/clickhouse-grafana/issues/342
- 修复 https://github.com/Altinity/clickhouse-grafana/issues/385
- 修复 https://github.com/Altinity/clickhouse-grafana/issues/317
- 修复 https://github.com/Altinity/clickhouse-grafana/issues/336
- 修复 https://github.com/Altinity/clickhouse-grafana/issues/320
- 修复 https://github.com/Altinity/clickhouse-grafana/issues/326
2.4.0 (2021-11-29)
增强
- 添加对 Grafana 8.x 统一告警的支持,修复 https://github.com/Altinity/clickhouse-grafana/issues/380
- 为插件后端告警部分添加 TLS 支持 https://github.com/Altinity/clickhouse-grafana/issues/356#issuecomment-906732530
- 添加 $naturalTimeSeries 宏,详情请参阅 https://github.com/Altinity/clickhouse-grafana/pull/89/files#diff-cd9133eda7b58ef9c9264190db4534a1be53216edbda9ac57256fbd800368c03R383-R412
- 将 golang-plugin-sdk-go 更新到最新版本
- 在表格格式中正确格式化 Value,详情请参阅 https://github.com/Altinity/clickhouse-grafana/pull/379
- 当时间列已经是 DateTime64 时,移除对该列的 toDateTime64 强制转换,以提高性能。更改测试以确保强制转换已从查询中移除,修复 https://github.com/Altinity/clickhouse-grafana/issues/360
- 实现
$timeFilter64ByColumn(column_name)宏,修复 https://github.com/Altinity/clickhouse-grafana/issues/343
修复
- 实现对告警查询的 GET 和 POST 的正确支持,修复 https://github.com/Altinity/clickhouse-grafana/issues/353
- SQL 语法高亮现在始终有效,修复 https://github.com/Altinity/clickhouse-grafana/issues/174, 修复 https://github.com/Altinity/clickhouse-grafana/issues/381
- 修复 https://github.com/Altinity/clickhouse-grafana/issues/376,
- 修复 $perSecondColumns 的负面行为 https://github.com/Altinity/clickhouse-grafana/issues/337
- 修复 https://github.com/Altinity/clickhouse-grafana/issues/374, 忽略引号内的
--作为注释
2.3.1 (2021-04-23)
重大变更
- 在最新的 Grafana 7.x 版本中,模板变量 SQL 查询应仅返回标量类型的值,请参阅 https://github.com/Altinity/clickhouse-grafana/issues/328
增强
- 添加对 Apple M1 的支持 ;)
- 切换到新的 grafana 插件 Golang SDK,感谢 @bmanth60 和 @valeriakononenko 的帮助
- 为告警添加 BasicAuth 支持,请参阅 https://github.com/Altinity/clickhouse-grafana/issues/267
修复
- 修复 github actions 后端构建
- 修复 UNION ALL 解析问题,请参阅 https://github.com/Altinity/clickhouse-grafana/issues/319
- 修复许多告警问题
- https://github.com/Altinity/clickhouse-grafana/issues/305
- https://github.com/Altinity/clickhouse-grafana/issues/327
- https://github.com/Altinity/clickhouse-grafana/issues/334
- https://github.com/Altinity/clickhouse-grafana/issues/335
2.2.3 (2021-02-17)
增强
- 通过 github actions 自动化插件签名过程,修复错误的可执行文件权限
2.2.0 (2020-11-30)
增强
- 向注解查询添加区域支持,尝试修复表格格式中列顺序错误的问题,修复 https://github.com/Altinity/clickhouse-grafana/issues/303
- 添加插件签名过程,修复 https://github.com/Altinity/clickhouse-grafana/issues/212
- 添加
DateTime64支持,修复 https://github.com/Altinity/clickhouse-grafana/issues/292 - 添加
linux\arm64后端插件构建 - 改进 ARRAY JOIN 解析,修复 https://github.com/Altinity/clickhouse-grafana/issues/284
- 改进
docker-compose.yaml,添加通过环境变量重新定义GRAFANA_VERSION和CLICKHOUSE_VERSION的功能,默认为latest
修复
- 将
*.js.map和*.js从 src 和 spec 文件夹添加到 .gitignore - 使用 $adhoc 宏时不再应用两次即时过滤器,修复 https://github.com/Altinity/clickhouse-grafana/issues/282
- 修复表格格式在元数据和数据响应部分之间列顺序错误的边界情况,修复 https://github.com/Altinity/clickhouse-grafana/issues/281
- 在 docker-compose 环境中添加 trickster
- 更新 README.md 中的链接
2.1.0 (2020-08-13)
增强
- 向查询编辑器添加“跳过注释”复选框,以便将 SQL 注释传递给服务器,修复 https://github.com/Altinity/clickhouse-grafana/issues/265
- 向 README 添加 Grafana 7.x 的设置说明
- 在浏览器端添加带有 <% js code subset %> 的 SQL 预处理逻辑,https://github.com/Altinity/clickhouse-grafana/pull/186,感谢 @fgbogdan
- 改进告警查询处理,适用于
query(query_name, from, to)时间范围小于可见仪表盘时间范围的情况,请参阅 https://github.com/Altinity/clickhouse-grafana/issues/237 - 改进 golang 部分的告警 json 解析,适用于响应中有被解释为系列名称的字符串字段的情况,请参阅 https://github.com/Altinity/clickhouse-grafana/issues/230
- 在插件的 golang 部分正确解析 POST 查询,https://github.com/Altinity/clickhouse-grafana/pull/228,感谢 @it1804
修复
- 修复 $macro + 子查询的边界情况,请参阅 https://github.com/Altinity/clickhouse-grafana/issues/276 和 https://github.com/Altinity/clickhouse-grafana/issues/277
- 修复并行查询执行,请参阅 https://github.com/Altinity/clickhouse-grafana/pull/273
- 修复标识符引号问题,请参阅 https://github.com/Altinity/clickhouse-grafana/issues/276, https://github.com/Altinity/clickhouse-grafana/issues/277
- 修复 plugin.json 以通过
grafana-plugin-repository插件验证器 - 修复多值变量行为 - https://github.com/Altinity/clickhouse-grafana/issues/252
- 添加 Vagrantfile 用于有状态环境,并允许升级场景,例如 grafana 7.1.0 + grafana-cli upgrade-all
- 修复 https://github.com/Altinity/clickhouse-grafana/issues/244
- 修复 https://github.com/Altinity/clickhouse-grafana/issues/243
- 为 github issues 添加多个仪表盘示例
- 修复 https://github.com/Altinity/clickhouse-grafana/issues/240
- 修复 https://github.com/Altinity/clickhouse-grafana/issues/135
- 修复 https://github.com/Altinity/clickhouse-grafana/issues/245
- 修复 https://github.com/Altinity/clickhouse-grafana/issues/238
- 修复 https://github.com/Altinity/clickhouse-grafana/issues/232
- 修复 https://github.com/Altinity/clickhouse-grafana/issues/127
- 修复 https://github.com/Altinity/clickhouse-grafana/issues/141
2.0.2 (2020-07-06)
改进
- 添加对 Windows 和 MacOSX 的告警支持
- 改进即时过滤器,用于查询字段值如
SELECT DISTINCT field AS value FROM db.table LIMIT 300,https://github.com/Altinity/clickhouse-grafana/pull/222 - 添加多 JOIN 解析功能 https://github.com/Altinity/clickhouse-grafana/pull/206
- docker-compose 环境的多项改进,添加自动仪表盘和数据源配置,有助于重现 Grafana + ClickHouse 中发生的多数边界情况
修复
- 对 grafana 仪表盘中 Date 和 DateTime 列的 UTC 时区应用变通方法 https://github.com/Altinity/clickhouse-grafana/issues/117
- 关于 $from 和 $to 的时间戳术语的清晰文档 https://github.com/Altinity/clickhouse-grafana/issues/115
- 修复 AST 解析边界情况,在
WHERE [test, 'test']中 "," 被跳过,修复即时 (ah-doc) AST FROM 递归解析 https://github.com/Altinity/clickhouse-grafana/issues/99 - 修复应用即时过滤器时表格函数解析的边界情况 https://github.com/Altinity/clickhouse-grafana/issues/130
- 修复 README.md 中的多个语法问题
- 修复 Clickhouse 到 Grafana Table 插件中 Float, Decimal 列的转换规则 https://github.com/Altinity/clickhouse-grafana/issues/199
- 修复 Grafana 模板变量值表示为字符串数组时的边界情况 https://github.com/Altinity/clickhouse-grafana/issues/169
- 修复 $macroFunctions AST 解析边界情况,FROM 语句的正确位置 https://github.com/Altinity/clickhouse-grafana/issues/187
2.0.1 (2020-06-19)
修复
- 修复 $columns, $perSecond, $perSecondColumns 宏的 golang 告警问题 https://github.com/Altinity/clickhouse-grafana/pull/200
2.0.0 (2020-06-17)
改进
- 兼容 grafana 7.x,请在
grafana.ini的 plugins 部分使用环境变量GF_PLUGINS_ALLOW_LOADING_UNSIGNED_PLUGINS=vertamedia-clickhouse-datasource或allow_loading_unsigned_plugins=vertamedia-clickhouse-datasourcehttps://github.com/Altinity/clickhouse-grafana/pull/192 - 添加 grafana 7.x 告警支持,感谢 Brian Thai https://github.com/bmanth60
- 向 $perSecondColumns 宏添加别名支持 https://github.com/Altinity/clickhouse-grafana/pull/193
- 支持
custom变量类型和$conditionalTest宏的空值 https://github.com/Altinity/clickhouse-grafana/pull/178 - 添加 docker-compose.yaml 以改进本地开发
修复
- 修复引号内引号转义的边界情况的 AST 问题 https://github.com/Altinity/clickhouse-grafana/pull/123, https://github.com/Altinity/clickhouse-grafana/pull/195
- 修复 https://github.com/Altinity/clickhouse-grafana/issues/179, 在查询编辑器中添加“外插”复选框
1.9.5 (2020-01-15)
修复
- SQL 语言解析器不支持注释 #95
1.9.4 (2019-11-27)
修复
- 即时过滤器对数值进行微调
- Metric builder 中的 UI 优化
1.9.3 (2019-10-18)
修复
- 即时过滤器改进,用于复杂用法
1.9.2 (2019-10-10)
修复
- 兼容性修复,支持 grafana 6.4.x
- 即时过滤器修复
- $conditionalTest ALL 值选项修复
1.9.0 (2019-08-12)
新特性
- 添加宏
conditionalTest(感谢 @TH-HA) #122 - 添加连接到 Yandex.Cloud ClickHouse 的支持 (感谢 @negasus) #106
修复
- 修复存在函数调用时的标识符反引号问题
- 修复引号的 AST 解析器错误 (感谢 @Fiery-Fenix) #128
- 将默认数据库添加到所有来自数据源选项的请求 (感谢 @Fiery-Fenix) #126
- 移除 lodash fcn composition (感谢 @simPod) #110
- 清理构建 (感谢 @simPod) #112
1.8.1 (2019-02-01)
新特性
- 添加
timeFilterByColumn宏 (感谢 @simPod) #68
修复
- 向查询添加 requestId,以便取消已放弃的查询 (感谢 @nvartolomei)
$unescape宏中的括号错误 #90- 表格视图中将字符串视为数字的错误 #97
1.8.0 (2018-11-07)
新特性
- 新的 $perSecond 和 $perSecondColumns 宏 (感谢 @simPod) #78 #80
- Date 列现在是可选的 #48
修复
- 延长带有 round 选项的查询的时间范围,以提供左右两端没有间隙的图表 #84
- adhocs: 通过与解析的查询或查询构建器设置进行比较,检查是否可以应用过滤器 #86
1.7.0 (2018-09-05)
新特性
- 为在内部查询中使用即时过滤器提供 $adhoc 宏 (感谢 @vavrusa)
- 允许通过
adhoc_query_filter变量为即时过滤器设置自定义查询 - 提供新的
Round值$step,用于根据图表分辨率变化进行自动舍入
1.6.0 (2018-08-07)
新特性
- 注解支持 (感谢 @atsirin)
- 允许在变量查询中使用
$from和$to宏 - README 中的配置示例
1.5.1 (2018-06-05)
修复
- 优化范围时间序列的内存使用 (感谢 @vavrusa)
- 在内部子查询中应用即时过滤器 (感谢 @vavrusa)
1.5.0 (2018-05-31)
新特性
- 新的数据源设置 -
default database。如果设置,它将预填在查询构建器中,并用于使即时过滤器更便捷 (感谢 @vavrusa) - 支持使用多个表的仪表盘的通配符即时过滤器 (感谢 @vavrusa)
- 从 GROUP BY 中解析维度以简化查询 (请参阅 piechart 和 worldmap 示例) (感谢 @vavrusa)
- 将
$timeCol重命名为$dateCol,以使列类型更清晰 (感谢 @simPod)
1.4.3 (2018-04-09)
修复
- 修复使用嵌套
SELECT但没有FROM语句时损坏的 AST (#45) - 严格的语句匹配 (#44)
- 仅在应用即时过滤器后才从 AST 重建查询
1.4.2 (2018-03-18)
修复
- 支持
UNION ALL语句 LIMIT N,M结构的正确格式 (感谢 @shankerwangmiao)- 更新
显示帮助部分,添加 $unescape 描述
1.4.1 (2018-03-12)
新特性
- $unescape - 通过移除单引号来解除变量值的转义。用于多值字符串变量,例如: "SELECT $unescape($column) FROM requests WHERE $unescape($column) = 5"
修复
- lambda 运算符
->在重新格式化查询时不再中断
1.4.0 (2018-03-08)
新特性
即时过滤器支持
- 如果存在即时变量,插件将获取所有数据库(系统数据库除外)中所有表的所有列作为标签。因此下拉菜单中将显示
database.table.column等选项 - 如果存在 ENUM 列,插件将获取它们的选项并将其用作标签值
- 如果其设置
$database和$table与即时过滤器的database.table相同,插件将把即时过滤器应用于仪表盘上的所有查询 - 无法为多个即时过滤器应用 OR 运算符 - 请参阅 grafana/grafana#10918
- 由于 Grafana 的限制,无法为即时过滤器使用 IN 运算符
1.3.1 (2018-02-12)
修复
- 支持 AST 中的数组索引
1.3.0 (2018-02-07)
新特性
- ace 编辑器中的列自动完成
1.2.7 (2018-01-05)
修复
- 使用保留名称时正确格式化查询
- 修复 #31
1.2.6 (2017-12-13)
修复
- 允许使用
round选项对时间过滤器 $from 和 $to 进行舍入
1.2.5 (2017-12-05)
修复
1.2.4 (2017-11-22)
修复
- 为表格格式应用正确的数值格式
1.2.3 (2017-11-20)
修复
- 提交生成的文件
1.2.2 (2017-11-20)
修复
1.2.1 (2017-11-17)
修复
1.2.0 (2017-11-15)
新特性
- Ace 编辑器
- ClickHouse 函数自动完成 (感谢 https://github.com/smi2/tabix.ui)