
Postgres 导出器
本页内容
简介
以下快速入门指南提供了 Postgres 导出器的设置说明以及预配置的仪表盘和告警规则。完成本快速入门指南中的步骤后,您将能够:
设置并配置 Postgres 导出器,以收集每秒查询数 (QPS) 和每秒抓取/返回/插入/更新/删除行数等 Postgres 指标。Postgres 导出器将以 Prometheus 格式暴露这些指标。
配置 Prometheus 抓取 Postgres 导出器指标,并选择性地将其发送到 Grafana Cloud。
导入 Grafana 仪表盘以可视化您的指标数据。
设置 Prometheus 告警规则以针对您的指标数据进行告警。
指标使用量
此导出器默认发布大约 450 个 Prometheus 时间序列。要查看此导出器默认发布的指标列表,请此处下载示例指标抓取文件。
请注意,根据配置不同,Postgres 导出器可能收集并发布比默认集合多得多的指标。要详细了解如何配置 Postgres 导出器及其收集器开关,请参阅 Postgres 导出器的 GitHub 仓库。
除了调整 Postgres 导出器的设置外,您还可以通过删除不需要存储在 Prometheus 或 Grafana Cloud 中的时间序列来减少指标使用量。要了解如何执行此操作,请参阅 Grafana Cloud 文档中的使用 relabeling 减少 Prometheus 指标使用量。
Grafana Cloud 的 Postgres 导出器集成
如果您正在使用 Grafana Cloud,则可以通过安装 Postgres 导出器集成来跳过本指南中的所有步骤,该集成旨在帮助您通过少量命令和点击即可快速启动和运行。免费注册。
要了解如何使用 Postgres 导出器集成设置 Postgres 导出器,请参阅 Grafana Cloud 文档中的Postgres 导出器集成。
本页内容
Postgres 导出器快速入门
在本指南中,您将学习如何设置和配置 Postgres 导出器,以收集每秒查询数 (QPS)、数据库死锁和冲突等 Postgres 指标,并以 Prometheus 格式暴露它们。然后,您将配置 Prometheus 抓取 Postgres 指标,并选择性地将它们发送到 Grafana Cloud。最后,您将设置一套预配置和精选的 Grafana 仪表盘和 告警规则。完成本指南后,您将拥有可用于可视化 Postgres 指标的仪表盘以及一套预配置的告警。
如果您正在使用 Grafana Cloud,Postgres 集成可以帮助您快速启动和运行。Postgres 集成将 Postgres 导出器嵌入到 Grafana Cloud Agent 中,并自动配置告警规则和仪表盘,这样您就不必按照本指南的步骤操作。要了解如何使用 Postgres 集成设置 Postgres 导出器,请参阅 Grafana Cloud 文档中的Postgres 集成。
前提条件
在开始之前,您应该准备好以下各项:
- 一台与 Postgres 导出器版本兼容的机器。要查看可用版本列表,请参阅版本发布页。
- 在您的机器上运行的 Postgres。要了解更多关于安装和运行 Postgres 的信息,请参阅 Postgres 安装指南。
- 在您的环境中或直接在机器上运行的 Prometheus。要了解如何安装 Prometheus,请参阅 Prometheus 文档中的安装指南。
- 在您的环境中或直接在机器上运行的 Grafana。要了解如何安装 Grafana,请参阅 Grafana 文档中的安装 Grafana。
- (可选)一个 Grafana Cloud 账户。Grafana Cloud 托管 Grafana 和基于 Mimir 的 Prometheus 指标端点。您仍然需要使用环境中安装的 Prometheus 或 Grafana Cloud Agent 抓取指标。要了解更多关于 Grafana Cloud 的信息,请参阅 Grafana Cloud。
步骤 1:设置 Postgres 导出器
在此步骤中,您将在您的机器上设置 Postgres 导出器,以收集和暴露 Prometheus 格式的 Postgres 指标。本指南使用带有 Postgres 13.2 的 Ubuntu 20.04 系统。具体步骤可能会因您的操作系统和 Postgres 版本略有不同。
首先,登录您的机器并下载相应的 Postgres 导出器二进制文件。本指南使用 linux-amd64 二进制文件,但您应该选择与您的系统操作系统和架构对应的文件:
wget https://github.com/prometheus-community/postgres_exporter/releases/download/v0.9.0/postgres_exporter-0.9.0.linux-amd64.tar.gz将 v0.9.0 替换为您想要安装的版本。本指南可能会过时,因此最好查看 Postgres 导出器 版本发布页 以获取最新的稳定版本。
解压 tar 包并 cd 进入目录:
tar xvfz postgres_exporter-*.linux-amd64.tar.gz
cd postgres_exporter-*.linux-amd64我们将以 postgres 用户身份运行 Postgres 导出器来获取数据库指标。要以非超级用户身份获取指标,您可以按照 Postgres 导出器 Github 仓库中的说明进行操作。
我们需要告知导出器如何连接到 Postgres 服务器。可以通过设置以下环境变量来实现:
export DATA_SOURCE_NAME='postgresql://postgres:enter_password_here@postgres_hostname:5432/postgres?sslmode=disable'请务必将 postgres 替换为您将用于从 Postgres 获取指标的用户,将 enter_password_here 替换为您用户的密码,并将 postgres_hostname 替换为 Postgres 实例的主机名(如果在同一台机器上,则为 localhost)。
最后,运行导出器:
./postgres_exporter
INFO[0000] Starting Server: :9187 source="postgres_exporter.go:1850"如果看到上述输出,则表示您已成功运行 Postgres 导出器。
Postgres 导出器在端口 9187 上以 Prometheus 格式发布 Postgres 指标。您可以使用 curl 进行测试。您需要打开一个新的 SSH 会话或将 Postgres 导出器进程置于后台才能使用 curl。
curl https://:9187/metrics# TYPE pg_exporter_scrapes_total counter
pg_exporter_scrapes_total 1
# HELP pg_locks_count Number of locks
# TYPE pg_locks_count gauge
pg_locks_count{datname="postgres",mode="accessexclusivelock",server="localhost:5432"} 0
pg_locks_count{datname="postgres",mode="accesssharelock",server="localhost:5432"} 1
pg_locks_count{datname="postgres",mode="exclusivelock",server="localhost:5432"} 0
pg_locks_count{datname="postgres",mode="rowexclusivelock",server="localhost:5432"} 0
pg_locks_count{datname="postgres",mode="rowsharelock",server="localhost:5432"} 0
pg_locks_count{datname="postgres",mode="sharelock",server="localhost:5432"} 0
pg_locks_count{datname="postgres",mode="sharerowexclusivelock",server="localhost:5432"} 0
pg_locks_count{datname="postgres",mode="shareupdateexclusivelock",server="localhost:5432"} 0
pg_locks_count{datname="postgres",mode="sireadlock",server="localhost:5432"} 0如果看到上述输出,您就可以开始使用 Prometheus 抓取 Postgres 指标了。
为了避免从命令行运行和管理 Postgres 导出器,您可以创建一个 systemd 服务。要了解如何执行此操作,请参阅创建 systemd 服务来管理 Agent。将 Agent 二进制文件的路径替换为 Postgres 导出器的路径。
您可以指定 --extend.query-path 标志指向您的 queries.yaml 文件路径,您可以在其中指定自定义查询。要详细了解这些功能,请参阅 Postgres 导出器 GitHub 仓库。
步骤 2:使用 Prometheus 抓取 Postgres 导出器数据
现在 Postgres 导出器已在您的机器上启动并运行,您可以配置 Prometheus 抓取任务来收集和存储 Postgres 导出器指标。
将以下抓取任务配置添加到您的 prometheus.yml 配置文件中的 scrape_configs 部分:
- job_name: postgres
  static_configs:
- targets: ['postgres_exporter_machine_IP_address:9187']将 postgres_exporter_machine_IP_address 替换为运行 Postgres 导出器的机器的 IP 地址。如果您在同一台机器上运行 Prometheus,则此处应为 localhost。要了解更多关于配置 Prometheus 的信息,请参阅 Prometheus 文档中的配置。
如果您没有 prometheus.yml 配置文件,可以使用您喜欢的文本编辑器创建一个简单的文件。打开您喜欢的文本编辑器,粘贴以下 Prometheus 配置:
global:
  scrape_interval: 15s

scrape_configs:
- job_name: postgres
  static_configs:
- targets: ['postgres_exporter_machine_IP_address:9187']此配置告诉 Prometheus 每 15 秒抓取所有任务一次。唯一配置的抓取任务名为 postgres,并定义了一个目标 postgres_exporter_machine_IP_address:9187。默认情况下,Prometheus 将使用 HTTP 抓取 /metrics 端点。
保存并关闭文件。然后您可以使用以下命令运行 Prometheus:
./prometheus --config.file=./prometheus.yml将指标发送到 Grafana Cloud
要将 Postgres 导出器指标从 Prometheus 发送到 Grafana Cloud,请在您的 prometheus.yml 配置文件中配置 remote_write 参数。要了解更多信息,请参阅 Grafana Cloud 文档中的指标 — Prometheus。要了解更多关于 remote_write 参数的信息,请参阅 Prometheus 文档中的remote_write。
步骤 3:配置仪表盘
本快速入门指南包含一个仪表盘:
- Postgres 概览
要了解如何将这些仪表盘导入 Grafana,请参阅 Grafana 文档中的导入仪表盘。
您可以此处获取仪表盘。
步骤 4:配置告警
使用 Prometheus 告警规则,您可以定义在 PromQL 表达式超过某个阈值或在一段时间内满足指定条件时触发的告警。例如,您可以定义一个 HighRequestLatency 告警,当请求延迟指标在一段时间内大于某个阈值时触发。一旦触发告警条件,告警将进入 Pending 状态。在满足 for 参数定义的时间段条件后,告警将进入 Firing 状态。您可以使用 Alertmanager 等工具配置触发告警的路由和通知。Grafana Cloud 也内置了 Alertmanager。
您可以此处获取告警规则 YAML 文件。
将告警规则加载到 Prometheus 中
要将告警规则加载到 Prometheus 中,请将以下内容添加到您的 prometheus.yml 配置文件中:
rule_files:
- "postgres_exporter_alerting_rules.yml"请务必将 postgres_exporter_alerting_rules.yml 替换为您的 Postgres 告警规则 YAML 文件的路径。
将告警规则加载到 Grafana Cloud 中
要了解如何将告警规则加载到 Grafana Cloud 中,请参阅使用 cortextool 管理 Prometheus 和 Loki 规则。
结论
在本快速入门指南中,您在 Linux 机器上安装并运行了 Postgres 导出器。然后您配置了 Prometheus 来抓取由 Postgres 导出器暴露的数据库和 Postgres 指标。您将告警规则加载到了 Prometheus 中,最后导入了 Grafana 仪表盘来可视化您的 Postgres 指标。
如果您正在使用 Grafana Cloud,则可以通过安装带有 Grafana Cloud Agent 的 Postgres 集成来跳过本指南中的所有步骤。该集成将预配置的 Postgres 导出器嵌入到 Agent 中,并自动配置 Grafana 仪表盘以及 Prometheus 告警和记录规则,因此您无需手动导入它们。要了解如何设置 Postgres 集成,请参阅Grafana Cloud 集成。
仪表盘、记录规则和告警规则是使用 Postgres 导出器 Mixin 生成的。Mixin 是由领域专家策划和设计的可复用仪表盘、记录规则和告警模板。要了解更多信息,请参阅 Postgres Mixin 仓库。
本页内容
Postgres 概览仪表盘
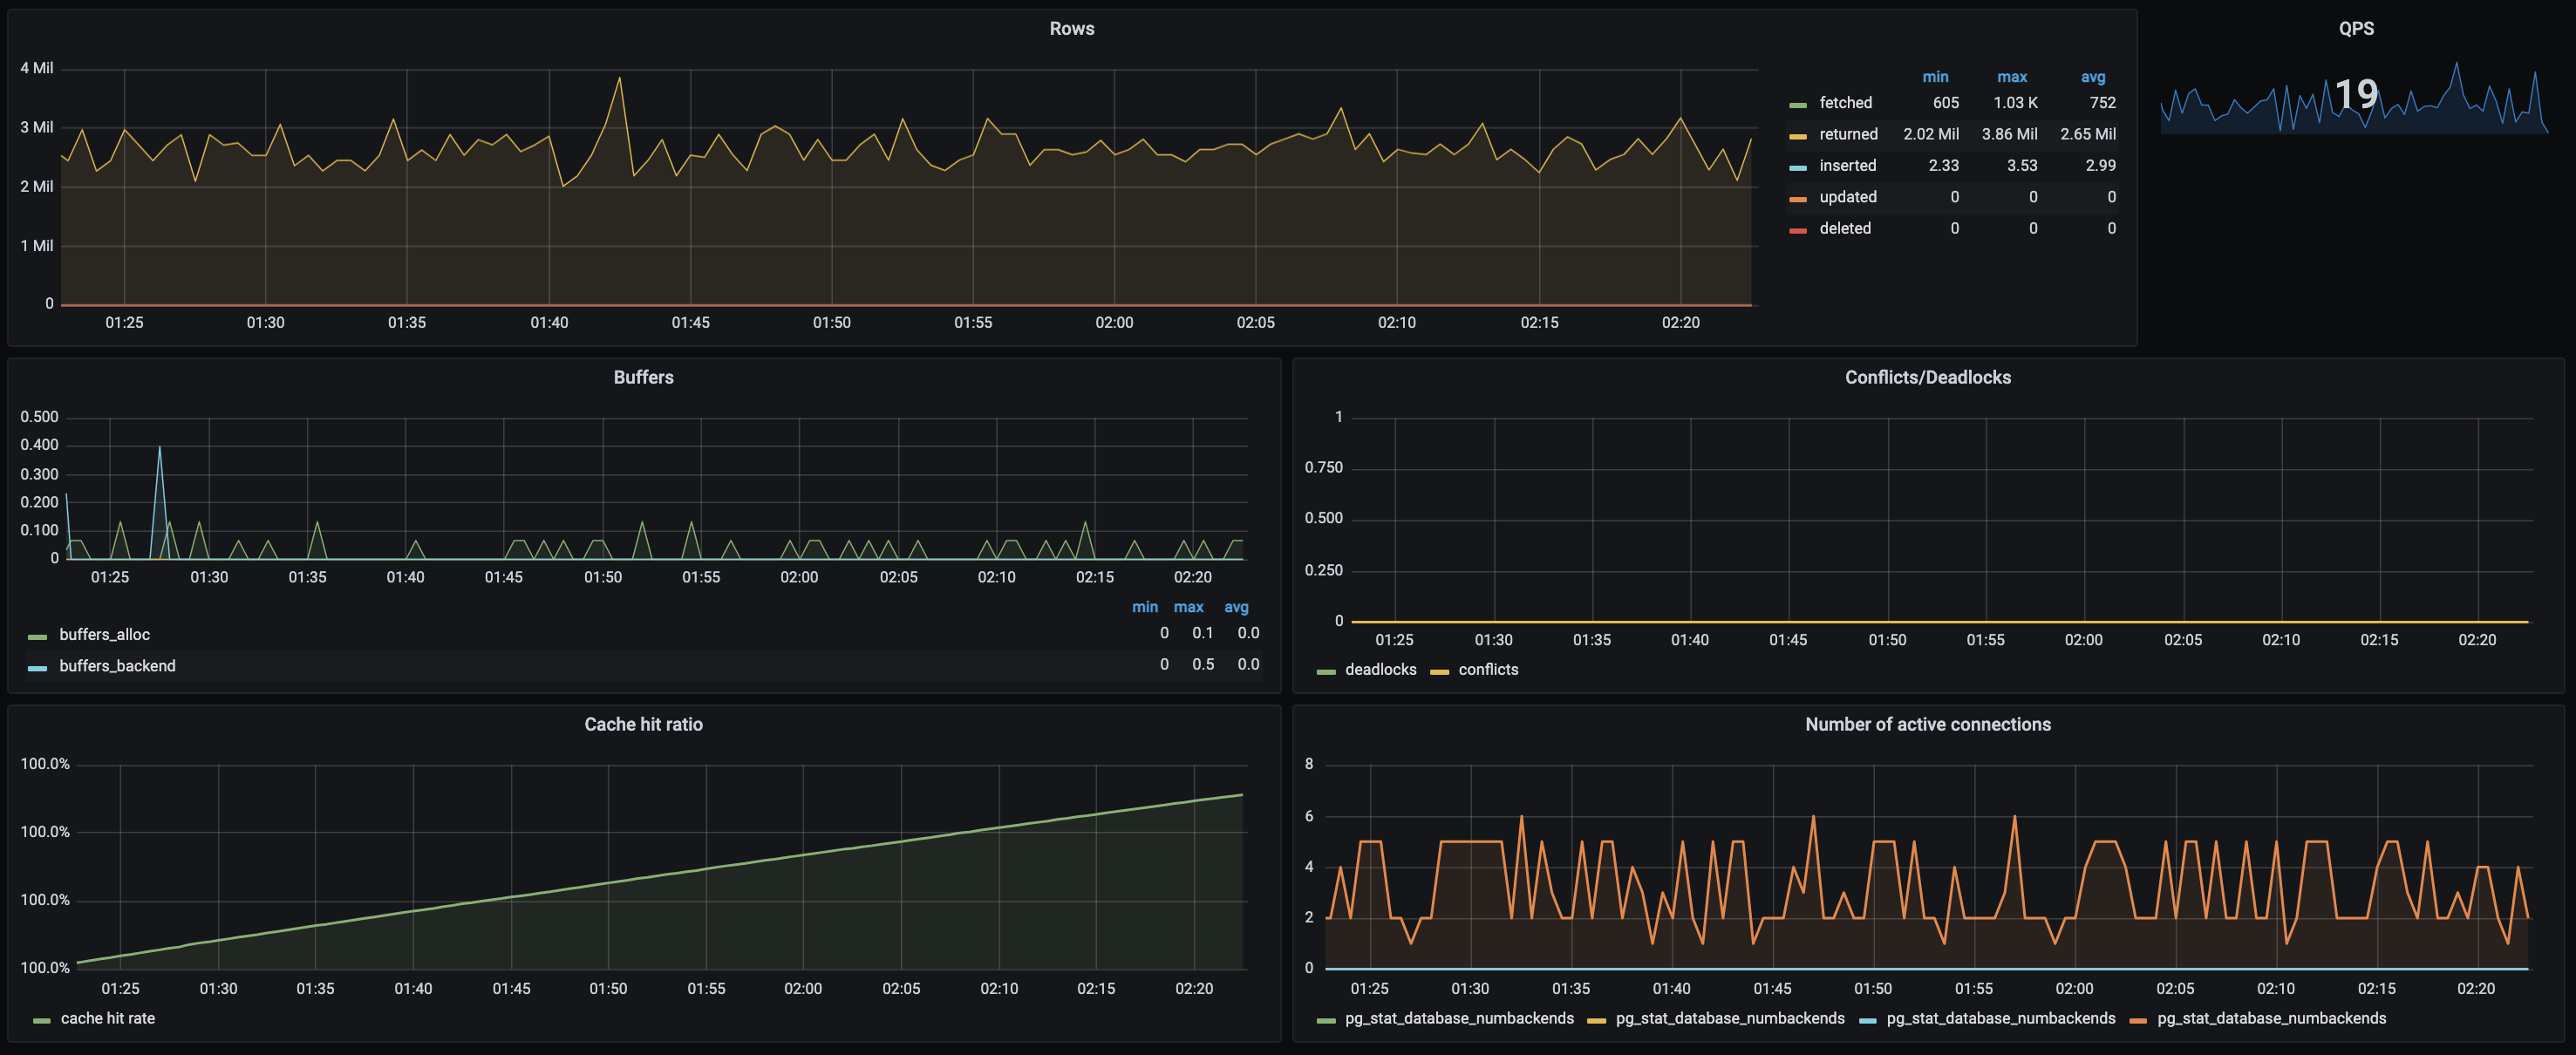
此仪表盘包含以下指标面板:
- 当前 QPS
- 抓取、返回、插入、更新、删除的行数
- 数据库死锁和冲突
- 缓存命中率
- 活动连接数
- 缓冲区
您可以使用以下仪表盘 ID 直接导入仪表盘:14114。
您可以此处获取仪表盘 JSON。
此仪表盘是使用 Postgres 导出器 mixin 生成的。
本页内容
本快速入门指南包含以下告警规则:
PostgreSQL 最大连接数已达上限
Postgres 可用连接已耗尽
PostgreSQL 连接数过高
Postgres 连接数已超过当前配置的最大 Postgres 连接限制的 80%
PostgreSQL 已宕机
Postgres 未处理查询
PostgreSQL 慢查询过多
Postgres 慢查询数量较多
PostgreSQL QPS 过高
Postgres 每秒查询数较高
PostgreSQL 缓存命中率较低
Postgres 缓存命中率较低
下载以下告警规则 YAML 文件:groups:
- name: PostgreSQL
rules:
- alert: PostgreSQLMaxConnectionsReached
expr: sum(pg_stat_activity_count) by (instance) >= sum(pg_settings_max_connections) by (instance) - sum(pg_settings_superuser_reserved_connections) by (instance)
for: 1m
labels:
severity: email
annotations:
summary: "{{ $labels.instance }} has maxed out Postgres connections."
description: "{{ $labels.instance }} is exceeding the currently configured maximum Postgres connection limit (current value: {{ $value }}s). Services may be degraded - please take immediate action (you probably need to increase max_connections in the Docker image and re-deploy."
- alert: PostgreSQLHighConnections
expr: sum(pg_stat_activity_count) by (instance) > (sum(pg_settings_max_connections) by (instance) - sum(pg_settings_superuser_reserved_connections) by (instance)) * 0.8
for: 10m
labels:
severity: email
annotations:
summary: "{{ $labels.instance }} is over 80% of max Postgres connections."
description: "{{ $labels.instance }} is exceeding 80% of the currently configured maximum Postgres connection limit (current value: {{ $value }}s). Please check utilization graphs and confirm if this is normal service growth, abuse or an otherwise temporary condition or if new resources need to be provisioned (or the limits increased, which is mostly likely)."
- alert: PostgreSQLDown
expr: pg_up != 1
for: 1m
labels:
severity: email
annotations:
summary: "PostgreSQL is not processing queries: {{ $labels.instance }}"
description: "{{ $labels.instance }} is rejecting query requests from the exporter, and thus probably not allowing DNS requests to work either. User services should not be effected provided at least 1 node is still alive."
- alert: PostgreSQLSlowQueries
expr: avg(rate(pg_stat_activity_max_tx_duration{datname!~"template.*"}[2m])) by (datname) > 2 * 60
for: 2m
labels:
severity: email
annotations:
summary: "PostgreSQL high number of slow on {{ $labels.cluster }} for database {{ $labels.datname }} "
description: "PostgreSQL high number of slow queries {{ $labels.cluster }} for database {{ $labels.datname }} with a value of {{ $value }} "
- alert: PostgreSQLQPS
expr: avg(irate(pg_stat_database_xact_commit{datname!~"template.*"}[5m]) + irate(pg_stat_database_xact_rollback{datname!~"template.*"}[5m])) by (datname) > 10000
for: 5m
labels:
severity: email
annotations:
summary: "PostgreSQL high number of queries per second {{ $labels.cluster }} for database {{ $labels.datname }}"
description: "PostgreSQL high number of queries per second on {{ $labels.cluster }} for database {{ $labels.datname }} with a value of {{ $value }}"
- alert: PostgreSQLCacheHitRatio
expr: avg(rate(pg_stat_database_blks_hit{datname!~"template.*"}[5m]) / (rate(pg_stat_database_blks_hit{datname!~"template.*"}[5m]) + rate(pg_stat_database_blks_read{datname!~"template.*"}[5m]))) by (datname) < 0.98
for: 5m
labels:
severity: email
annotations:
summary: "PostgreSQL low cache hit rate on {{ $labels.cluster }} for database {{ $labels.datname }}"
description: "PostgreSQL low on cache hit rate on {{ $labels.cluster }} for database {{ $labels.datname }} with a value of {{ $value }}"此告警规则 YAML 文件是使用 Postgres 导出器 mixin 生成的。
本页内容
Grafana Cloud 提供不断丰富的集成,帮助您在几分钟内快速启动并运行可观测性技术栈。内置于 Grafana Cloud Agent 中的 Postgres 集成暴露并抓取关键的 Postgres 指标,并将其推送到 Grafana Cloud。Agent 将使用嵌入式 Postgres 导出器抓取指标,Grafana Cloud 将自动配置定制的 Grafana 仪表盘和告警,用于可视化这些数据并采取行动。
要了解更多信息,请查看Grafana Cloud 文档。
工作原理
配置、安装、连接和维护 Prometheus 监控组件通常需要大量的领域知识。从设置到拥有仪表盘和告警可能需要相当长的时间。作为 Grafana 的创建者以及 Prometheus 和 Cortex 的核心贡献者,我们构建了简单的集成来抽象掉部分工作,以便快速入门。工作原理如下:
- 注册(或登录)一个免费的 Grafana Cloud 账户。
- 选择您想要观测的目标(不断扩展的目录)。
- 运行一行命令安装 Grafana Agent。Agent 嵌入并预配置了 Exporter,以暴露默认指标,并将其推送到 Grafana Cloud 指标后端。
- 大功告成!您将看到定制的 Grafana 仪表盘,并可利用合理的默认告警。
正在寻找其他 Exporter 或集成?查看我们不断增长的流行组件集成库,例如 MySQL、Postgres、Redis、Memcached 等。