
Node Exporter
本页内容
介绍
以下快速入门提供了 Node Exporter 的设置说明以及预配置的仪表盘、告警规则和记录规则。完成此快速入门中的步骤后,您将:
设置并配置 Node Exporter 以收集 Linux 系统指标,如 CPU 负载和磁盘 I/O。Node Exporter 将这些指标以 Prometheus 风格暴露。
配置 Prometheus 抓取 Node Exporter 指标,并可选择将其发送到 Grafana Cloud。
设置一组预配置和精选的记录规则来缓存频繁查询。
导入 Grafana 仪表盘以可视化您的指标数据。
设置 Prometheus 告警规则以根据您的指标数据发出告警。
指标用量
该 Exporter 默认发布大约 500 个 Prometheus 时间序列。要查看此 Exporter 默认发布的指标列表,请在此处下载示例指标抓取。
请注意,根据其配置,Node Exporter 可能会收集和发布远超此默认集合的指标。要了解有关配置 Node Exporter 和切换其收集器的更多信息,请参阅 Node Exporter 的 GitHub 仓库。
除了切换 Node Exporter 的设置外,您还可以通过丢弃不需要存储在 Prometheus 或 Grafana Cloud 中的时间序列来减少指标用量。要了解如何执行此操作,请参阅 Grafana Cloud 文档中的使用 relabeling 减少 Prometheus 指标用量。
Grafana Cloud 的 Linux Node 集成
如果您正在使用 Grafana Cloud,通过安装 Linux Server 集成,您可以通过几个命令和点击跳过本指南中的所有步骤,该集成旨在帮助您快速入门并运行。免费注册。
要了解如何使用 Linux Server 集成设置 Node Exporter,请参阅 Grafana Cloud 文档中的使用 Linux 主机集成监控 Linux 主机。
本页内容
Node Exporter 快速入门
在本指南中,您将学习如何设置和配置 Node Exporter 以收集 Linux 系统指标(如 CPU 负载和磁盘 I/O)并将其以 Prometheus 风格暴露。然后,您将配置 Prometheus 抓取 Node Exporter 指标,并可选择将其发送到 Grafana Cloud。最后,您将设置一组预配置和精选的记录规则、Grafana 仪表盘和告警规则。在本指南结束时,您将拥有可用于可视化 Linux 系统指标的仪表盘,以及一组预配置的告警。
如果您正在使用 Grafana Cloud,Linux Server 集成可以帮助您快速启动并运行。Linux 集成将 Node Exporter 嵌入到 Grafana Agent 中,并自动配置告警规则和仪表盘,因此您无需执行本指南中的步骤。要了解如何使用 Linux Server 集成设置 Node Exporter,请参阅 Grafana Cloud 文档中的使用 Linux 主机集成监控 Linux 主机。
先决条件
在开始之前,您应该具备以下条件:
- 与 Node Exporter 版本兼容的 Linux 机器。有关可用版本列表,请参阅版本。
- 在您的环境或直接在 Linux 机器上运行的 Prometheus。要了解如何安装 Prometheus,请参阅 Prometheus 文档中的安装。
- 在您的环境或直接在 Linux 机器上运行的 Grafana。要了解如何安装 Grafana,请参阅 Grafana 文档中的安装 Grafana。
- (可选)Grafana Cloud 账户。Grafana Cloud 托管 Grafana 和基于 Mimir 的 Prometheus 指标端点。您仍然需要抓取指标,可以使用在您环境中安装的 Prometheus,或使用 Grafana Agent。要了解有关 Grafana Cloud 的更多信息,请参阅Grafana Cloud。
步骤 1:设置 Node Exporter
在此步骤中,您将在 Linux 机器上设置 Node Exporter,以收集和暴露系统指标。
首先,登录您的机器并下载相关的 Node Exporter 二进制文件。在本指南中,我们将使用 linux-amd64,但您应该选择与您的系统操作系统和架构对应的文件。
wget https://github.com/prometheus/node_exporter/releases/download/v1.1.1/node_exporter-1.1.1.linux-amd64.tar.gz将 1.1.1 替换为您要安装的版本。本指南可能会过时,因此最好查看 Node Exporter 的版本页面以获取最新的稳定版本。
解压缩 tarball 并 cd 进入目录。
tar xvfz node_exporter-*.*-amd64.tar.gz
cd node_exporter-*.*-amd64运行 Node Exporter 二进制文件。
./node_exporterlevel=info ts=2021-02-15T03:35:18.396Z caller=node_exporter.go:178 msg="Starting node_exporter" version="(version=1.1.1, branch=HEAD, revision=4e837d4da79cc59ee3ed1471ba9a0d9547e95540)"
level=info ts=2021-02-15T03:35:18.396Z caller=node_exporter.go:179 msg="Build context" build_context="(go=go1.15.8, user=root@7abcc101f1c2, date=20210213-13:30:54)"
level=warn ts=2021-02-15T03:35:18.396Z caller=node_exporter.go:181 msg="Node Exporter is running as root user. This exporter is designed to run as unpriviledged user, root is not required."
level=info ts=2021-02-15T03:35:18.397Z caller=filesystem_common.go:74 collector=filesystem msg="Parsed flag --collector.filesystem.ignored-mount-points" flag=^/(dev|proc|sys|var/lib/docker/.+)($|/)
level=info ts=2021-02-15T03:35:18.397Z caller=filesystem_common.go:76 collector=filesystem msg="Parsed flag --collector.filesystem.ignored-fs-types" flag=^(autofs|binfmt_misc|bpf|cgroup2?|configfs|debugfs|devpts|devtmpfs|fusectl|hugetlbfs|iso9660|mqueue|nsfs|overlay|proc|procfs|pstore|rpc_pipefs|securityfs|selinuxfs|squashfs|sysfs|tracefs)$
level=info ts=2021-02-15T03:35:18.397Z caller=node_exporter.go:106 msg="Enabled collectors"
level=info ts=2021-02-15T03:35:18.397Z caller=node_exporter.go:113 collector=arp
level=info ts=2021-02-15T03:35:18.397Z caller=node_exporter.go:113 collector=bcache
. . .
level=info ts=2021-02-15T03:38:01.468Z caller=node_exporter.go:113 collector=zfs
level=info ts=2021-02-15T03:38:01.468Z caller=node_exporter.go:195 msg="Listening on" address=:9100
level=info ts=2021-02-15T03:38:01.468Z caller=tls_config.go:191 msg="TLS is disabled." http2=false如果看到上述输出,说明您已成功运行 Node Exporter。
Node Exporter 在端口 9100 上以 Prometheus 格式发布您的系统指标。您可以使用 curl 进行测试。您需要打开一个新的 SSH 会话或将 Node Exporter 进程放到后台才能使用 curl。
curl https://:9100/metrics. . .
process_virtual_memory_max_bytes 1.8446744073709552e+19
## HELP promhttp_metric_handler_errors_total Total number of internal errors encountered by the promhttp metric handler.
## TYPE promhttp_metric_handler_errors_total counter
promhttp_metric_handler_errors_total{cause="encoding"} 0
promhttp_metric_handler_errors_total{cause="gathering"} 0
## HELP promhttp_metric_handler_requests_in_flight Current number of scrapes being served.
## TYPE promhttp_metric_handler_requests_in_flight gauge
promhttp_metric_handler_requests_in_flight 1
## HELP promhttp_metric_handler_requests_total Total number of scrapes by HTTP status code.
## TYPE promhttp_metric_handler_requests_total counter
promhttp_metric_handler_requests_total{code="200"} 0
promhttp_metric_handler_requests_total{code="500"} 0
promhttp_metric_handler_requests_total{code="503"} 0如果看到上述输出,您就可以开始使用 Prometheus 抓取 Node Exporter 指标了。
为了避免从命令行运行和管理 Node Exporter,您可以创建一个 systemd 服务。要了解如何执行此操作,请参阅创建 systemd 服务来管理 Agent。将 Agent 二进制文件的路径替换为 Node Exporter 的路径。
步骤 2:使用 Prometheus 抓取 Node Exporter 指标
现在 Node Exporter 已在您的机器上启动并运行,您可以配置 Prometheus 抓取作业来收集和存储 Node Exporter 指标。
将以下抓取作业配置添加到您的 prometheus.yml 配置文件中的 scrape_configs 部分:
- job_name: node
  static_configs:
- targets: ['linux_machine_IP_address:9100']将 linux_machine_IP_address 替换为运行 Node Exporter 的机器的 IP 地址。如果您在同一台机器上运行 Prometheus,则应为 localhost。要了解有关配置 Prometheus 的更多信息,请参阅 Prometheus 文档中的配置。
如果您没有 prometheus.yml 配置文件,可以使用您喜欢的文本编辑器创建一个简单的文件。打开您首选的文本编辑器,并粘贴以下 Prometheus 配置:
global:
  scrape_interval: 15s

scrape_configs:
- job_name: node
  static_configs:
- targets: ['linux_machine_IP_address:9100']此配置告诉 Prometheus 每 15 秒抓取所有作业。唯一配置的抓取作业名为 node,并定义了一个 linux_machine_IP_address:9100 目标。默认情况下,Prometheus 将使用 HTTP 抓取 /metrics 端点。
保存并关闭文件。然后您可以使用以下命令运行 Prometheus:
./prometheus --config.file=./prometheus.yml将指标发送到 Grafana Cloud
要将 Node Exporter 指标从 Prometheus 发送至 Grafana Cloud,请在您的 prometheus.yml 配置文件中配置 remote_write 参数。要了解更多信息,请参阅 Grafana Cloud 文档中的指标 — Prometheus。要了解有关 remote_write 参数的更多信息,请参阅 Prometheus 文档中的remote_write。
步骤 3:配置记录规则
通过使用记录规则,您可以预计算并缓存频繁查询的指标。例如,如果仪表盘面板使用计算密集型查询(如 rate()),您可以创建一个记录规则,该规则以固定的较低间隔运行,并将密集型查询的结果保存到新的时间序列中。这样可以避免每次仪表盘刷新时都抓取和计算数据。要了解有关 Prometheus 记录规则的更多信息,请参阅 Prometheus 文档中的记录规则。
您应该在本指南中加载仪表盘之前加载以下记录规则。仪表盘查询使用记录规则来减少 Prometheus 或 Grafana Cloud Metrics 服务器上的负载,具体取决于您在何处评估规则。
您可以在此处获取记录规则 YAML 文件。
将记录规则加载到 Prometheus 中
要将记录规则加载到 Prometheus 中,请在您的 prometheus.yml 配置文件中添加以下内容:
rule_files:
- "node_exporter_recording_rules.yml"请务必将 node_exporter_recording_rules.yml 替换为您的 Node Exporter 记录规则 YAML 文件的路径。
将记录规则加载到 Grafana Cloud 中
要了解如何将记录规则加载到 Grafana Cloud 中,请参阅使用 cortextool 处理 Prometheus 和 Loki 规则。
步骤 4:配置仪表盘
此快速入门包含以下三个仪表盘:
- 节点仪表盘
- USE 方法 / 节点仪表盘
- USE 方法 / 集群仪表盘
要了解如何将这些仪表盘导入 Grafana,请参阅 Grafana 文档中的导入仪表盘。
仪表盘查询依赖于上一步中定义的记录规则。请务必在导入仪表盘之前导入这些规则。
您可以在此处获取仪表盘。
步骤 5:配置告警
通过 Prometheus 告警规则,您可以定义在 PromQL 表达式在一段时间内违反某个阈值或满足指定条件时触发的告警。例如,您可以定义一个 HighRequestLatency 告警,当请求延迟指标在一段时间内大于某个阈值时触发。一旦触发告警条件,告警将进入 Pending 状态。在满足由 for 参数定义的时间段的条件后,告警将进入 Firing 状态。您可以使用 Alertmanager 等工具配置触发告警的路由和通知。Alertmanager 也内置在 Grafana Cloud 中。
您可以在此处获取告警规则 YAML 文件。
将告警规则加载到 Prometheus 中
要将告警规则加载到 Prometheus 中,请将以下内容添加到您的 prometheus.yml 配置文件中:
rule_files:
- "node_exporter_alerting_rules.yml"请务必将 node_exporter_alerting_rules.yml 替换为您的 Node Exporter 告警规则 YAML 文件的路径。
将告警规则加载到 Grafana Cloud 中
要了解如何将告警规则加载到 Grafana Cloud 中,请参阅使用 cortextool 处理 Prometheus 和 Loki 规则。
结论
在此快速入门中,您在 Linux 机器上安装并运行了 Node Exporter。然后,您配置了 Prometheus 抓取 Node Exporter 暴露的系统指标。您将记录规则和告警规则加载到 Prometheus 中,最后导入 Grafana 仪表盘以可视化您的 Linux 系统指标。
如果您正在使用 Grafana Cloud,通过使用 Grafana Agent 安装 Linux Server 集成,您可以跳过本指南中的所有步骤。此集成将预配置的 Node Exporter 嵌入到 Agent 中,并自动配置 Grafana 仪表盘以及 Prometheus 告警和记录规则,因此您无需手动导入它们。要了解如何设置 Linux Server 集成,请参阅使用 Linux 主机集成监控 Linux 主机。
这些仪表盘、记录规则和告警规则是使用 Node Exporter Mixin 生成的。Mixins 是由主题专家策划和设计的可重用仪表盘、记录规则和告警模板。要了解更多信息,请参阅 Node Mixin 仓库。
本页内容
您应该在本指南中加载仪表盘之前加载以下记录规则。仪表盘查询使用记录规则来减少 Prometheus 或 Grafana Cloud Metrics 服务器上的负载,具体取决于您在何处评估规则。
此快速入门包括以下记录规则:
instance:node_num_cpu:suminstance:node_cpu_utilisation:rate1minstance:node_load1_per_cpu:ratioinstance:node_memory_utilisation:ratioinstance:node_vmstat_pgmajfault:rate1minstance_device:node_disk_io_time_seconds:rate1minstance_device:node_disk_io_time_weighted_seconds:rate1minstance:node_network_receive_bytes_excluding_lo:rate1minstance:node_network_transmit_bytes_excluding_lo:rate1minstance:node_network_receive_drop_excluding_lo:rate1minstance:node_network_transmit_drop_excluding_lo:rate1m
"groups":
- "name": "node-exporter.rules"
  "rules":
  - "expr": |
      count without (cpu) (
        count without (mode) (
          node_cpu_seconds_total{job="node"}
        )
      )
    "record": "instance:node_num_cpu:sum"
  - "expr": |
      1 - avg without (cpu, mode) (
        rate(node_cpu_seconds_total{job="node", mode="idle"}[1m])
      )
    "record": "instance:node_cpu_utilisation:rate1m"
  - "expr": |
      (
        node_load1{job="node"}
      /
        instance:node_num_cpu:sum{job="node"}
      )
    "record": "instance:node_load1_per_cpu:ratio"
  - "expr": |
      1 - (
        node_memory_MemAvailable_bytes{job="node"}
      /
        node_memory_MemTotal_bytes{job="node"}
      )
    "record": "instance:node_memory_utilisation:ratio"
  - "expr": |
      rate(node_vmstat_pgmajfault{job="node"}[1m])
    "record": "instance:node_vmstat_pgmajfault:rate1m"
  - "expr": |
      rate(node_disk_io_time_seconds_total{job="node", device!=""}[1m])
    "record": "instance_device:node_disk_io_time_seconds:rate1m"
  - "expr": |
      rate(node_disk_io_time_weighted_seconds_total{job="node", device!=""}[1m])
    "record": "instance_device:node_disk_io_time_weighted_seconds:rate1m"
  - "expr": |
      sum without (device) (
        rate(node_network_receive_bytes_total{job="node", device!="lo"}[1m])
      )
    "record": "instance:node_network_receive_bytes_excluding_lo:rate1m"
  - "expr": |
      sum without (device) (
        rate(node_network_transmit_bytes_total{job="node", device!="lo"}[1m])
      )
    "record": "instance:node_network_transmit_bytes_excluding_lo:rate1m"
  - "expr": |
      sum without (device) (
        rate(node_network_receive_drop_total{job="node", device!="lo"}[1m])
      )
    "record": "instance:node_network_receive_drop_excluding_lo:rate1m"
  - "expr": |
      sum without (device) (
        rate(node_network_transmit_drop_total{job="node", device!="lo"}[1m])
      )
"record": "instance:node_network_transmit_drop_excluding_lo:rate1m"此记录规则 YAML 文件是使用 Node Exporter mixin 生成的。它默认使用 job=node 标签选择器查询指标。如果您需要使用不同的选择器,请在 config.libsonnet 中修改选择器,然后按照 mixin 仓库中的说明重新生成仪表盘。
本页内容
注意:这些仪表盘依赖于前一个标签页中的记录规则。请务必在导入仪表盘之前导入这些规则。
节点仪表盘
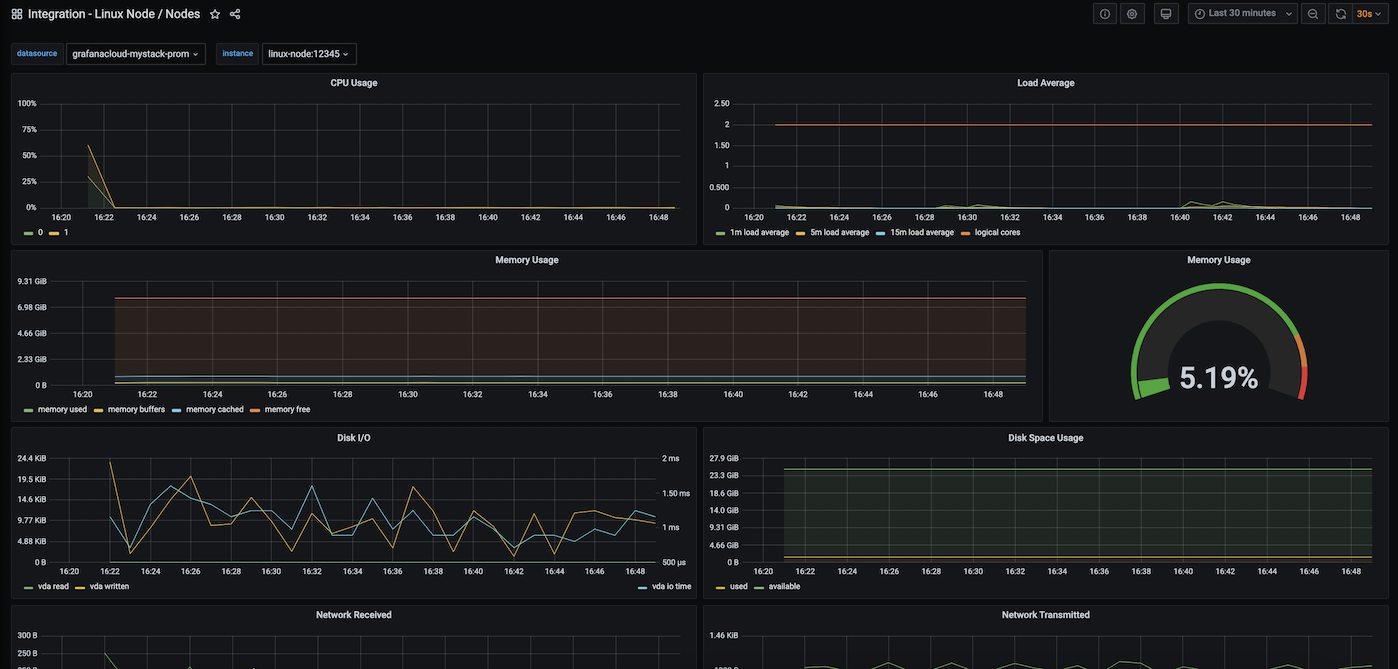
此仪表盘包含以下指标的面板:
- CPU 使用率
- 平均负载
- 内存使用率
- 磁盘 I/O
- 磁盘用量
- 网络接收
- 网络发送
您可以直接使用以下仪表盘 ID 导入仪表盘:13978
您也可以在此处直接下载仪表盘 JSON。
USE 方法 / 节点仪表盘
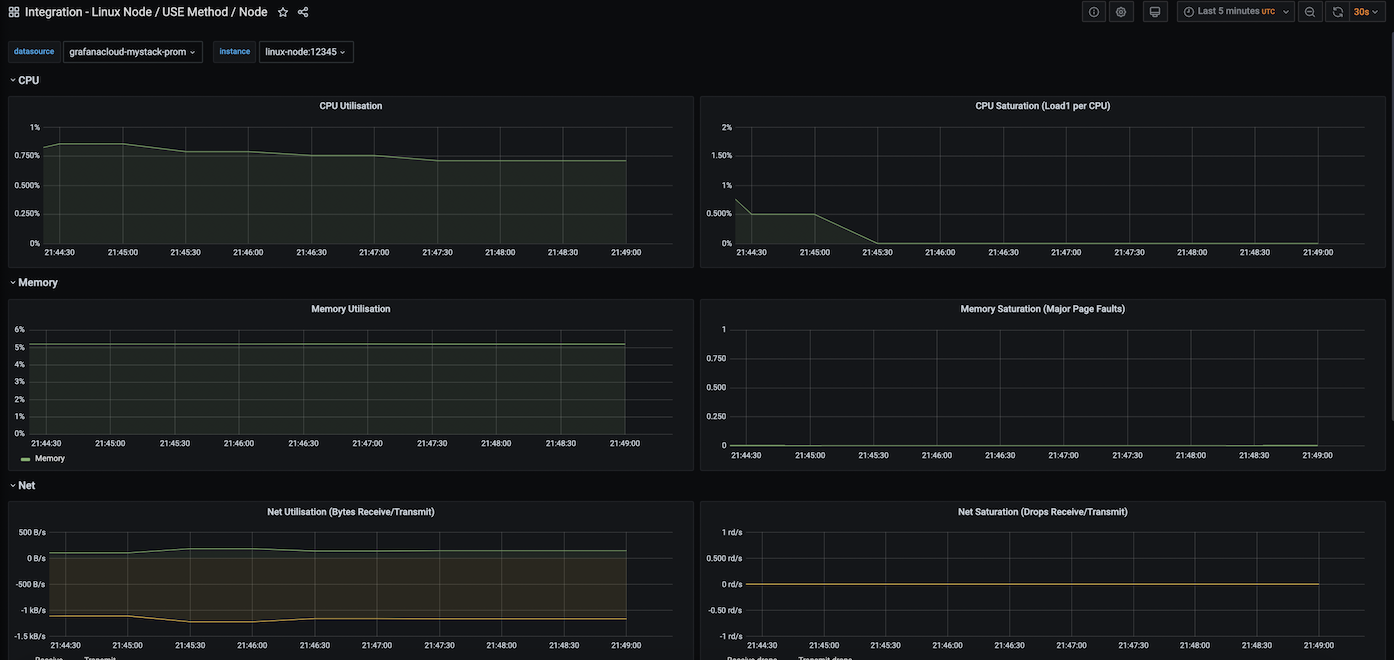
此仪表盘包含以下指标的面板。要了解有关 USE (利用率、饱和度和错误) 指标的更多信息,请参阅USE 方法
- CPU 利用率
- CPU 饱和度 (每 CPU 负载)
- 内存利用率
- 内存饱和度 (主页面错误)
- 网络利用率 (接收/发送字节数)
- 网络饱和度 (接收/发送丢包)
- 磁盘 I/O 利用率
- 磁盘 I/O 饱和度
您可以直接使用以下仪表盘 ID 导入仪表盘:13977
您也可以在此处直接下载仪表盘 JSON。
USE 方法 / 集群仪表盘
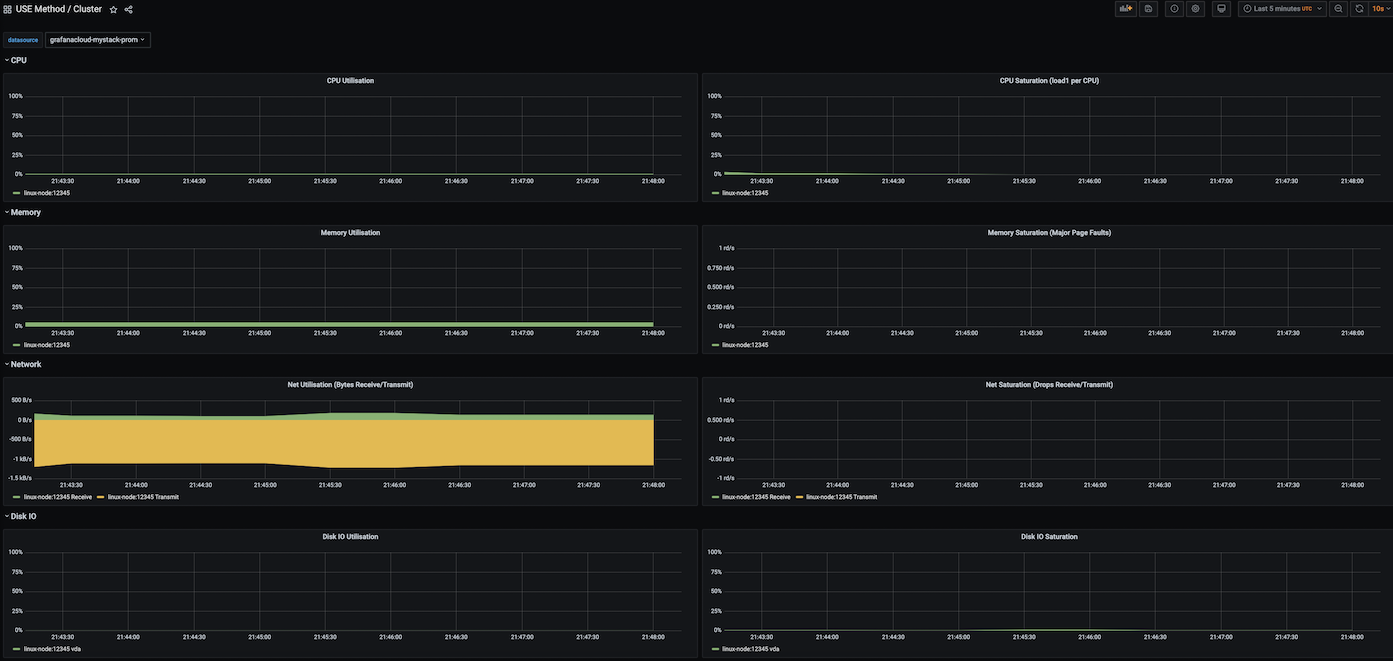
此仪表盘类似于 USE 方法 / 节点仪表盘,但提供相同指标的集群级视图。它包含以下指标的面板:
- CPU 利用率
- CPU 饱和度 (每 CPU 负载)
- 内存利用率
- 内存饱和度 (主页面错误)
- 网络利用率 (接收/发送字节数)
- 网络饱和度 (接收/发送丢包)
- 磁盘 I/O 利用率
- 磁盘 I/O 饱和度
您可以直接使用以下仪表盘 ID 导入仪表盘:13971
您也可以在此处直接下载仪表盘 JSON。
这些仪表盘是使用 Node Exporter mixin 生成的。它们默认使用 job=node 标签选择器查询指标。如果您需要使用不同的选择器,请在 config.libsonnet 中修改选择器,然后按照 mixin 仓库中的说明重新生成仪表盘。
本页内容
此快速入门包括以下告警规则:
NodeFilesystemSpaceFillingUp实例上设备的磁盘空间剩余 X,且正在被填满。
NodeFilesystemAlmostOutOfSpace实例上设备的磁盘空间仅剩余 X。
NodeFilesystemFilesFillingUp实例上设备的 inodes 仅剩余 X,且正在被填满。
NodeFilesystemAlmostOutOfFiles实例上设备的 inodes 仅剩余 X
NodeNetworkReceiveErrs实例接口设备在过去两分钟内遇到了 X 个接收错误。
NodeHighNumberConntrackEntriesUsed已使用 X% 的 conntrack 条目。
NodeTextFileCollectorScrapeErrorNode Exporter 文本文件收集器抓取失败。
NodeClockSkewDetected实例上的时钟偏离超过 300 秒。请确保在此主机上正确配置了 NTP。
NodeClockNotSynchronising实例上的时钟未同步。请确保在此主机上配置了 NTP。
NodeRAIDDegraded由于一个或多个磁盘故障,实例上的 RAID 阵列“设备”处于降级状态。备用驱动器数量不足以自动修复问题。
NodeRAIDDiskFailure实例上的 RAID 阵列中至少一个设备发生故障。阵列“设备”需要注意,可能需要更换磁盘。
"groups":
- "name": "node-exporter"
  "rules":
  - "alert": "NodeFilesystemSpaceFillingUp"
    "annotations":
      "description": "Filesystem on {{ $labels.device }} at {{ $labels.instance }} has only {{ printf \"%.2f\" $value }}% available space left and is filling up."
      "summary": "Filesystem is predicted to run out of space within the next 24 hours."
    "expr": |
      (
        node_filesystem_avail_bytes{job="node",fstype!=""} / node_filesystem_size_bytes{job="node",fstype!=""} * 100 < 40
      and
        predict_linear(node_filesystem_avail_bytes{job="node",fstype!=""}[6h], 24*60*60) < 0
      and
        node_filesystem_readonly{job="node",fstype!=""} == 0
      )
    "for": "1h"
    "labels":
      "severity": "warning"
  - "alert": "NodeFilesystemSpaceFillingUp"
    "annotations":
      "description": "Filesystem on {{ $labels.device }} at {{ $labels.instance }} has only {{ printf \"%.2f\" $value }}% available space left and is filling up fast."
      "summary": "Filesystem is predicted to run out of space within the next 4 hours."
    "expr": |
      (
        node_filesystem_avail_bytes{job="node",fstype!=""} / node_filesystem_size_bytes{job="node",fstype!=""} * 100 < 20
      and
        predict_linear(node_filesystem_avail_bytes{job="node",fstype!=""}[6h], 4*60*60) < 0
      and
        node_filesystem_readonly{job="node",fstype!=""} == 0
      )
    "for": "1h"
    "labels":
      "severity": "critical"
  - "alert": "NodeFilesystemAlmostOutOfSpace"
    "annotations":
      "description": "Filesystem on {{ $labels.device }} at {{ $labels.instance }} has only {{ printf \"%.2f\" $value }}% available space left."
      "summary": "Filesystem has less than 5% space left."
    "expr": |
      (
        node_filesystem_avail_bytes{job="node",fstype!=""} / node_filesystem_size_bytes{job="node",fstype!=""} * 100 < 5
      and
        node_filesystem_readonly{job="node",fstype!=""} == 0
      )
    "for": "1h"
    "labels":
      "severity": "warning"
  - "alert": "NodeFilesystemAlmostOutOfSpace"
    "annotations":
      "description": "Filesystem on {{ $labels.device }} at {{ $labels.instance }} has only {{ printf \"%.2f\" $value }}% available space left."
      "summary": "Filesystem has less than 3% space left."
    "expr": |
      (
        node_filesystem_avail_bytes{job="node",fstype!=""} / node_filesystem_size_bytes{job="node",fstype!=""} * 100 < 3
      and
        node_filesystem_readonly{job="node",fstype!=""} == 0
      )
    "for": "1h"
    "labels":
      "severity": "critical"
  - "alert": "NodeFilesystemFilesFillingUp"
    "annotations":
      "description": "Filesystem on {{ $labels.device }} at {{ $labels.instance }} has only {{ printf \"%.2f\" $value }}% available inodes left and is filling up."
      "summary": "Filesystem is predicted to run out of inodes within the next 24 hours."
    "expr": |
      (
        node_filesystem_files_free{job="node",fstype!=""} / node_filesystem_files{job="node",fstype!=""} * 100 < 40
      and
        predict_linear(node_filesystem_files_free{job="node",fstype!=""}[6h], 24*60*60) < 0
      and
        node_filesystem_readonly{job="node",fstype!=""} == 0
      )
    "for": "1h"
    "labels":
      "severity": "warning"
  - "alert": "NodeFilesystemFilesFillingUp"
    "annotations":
      "description": "Filesystem on {{ $labels.device }} at {{ $labels.instance }} has only {{ printf \"%.2f\" $value }}% available inodes left and is filling up fast."
      "summary": "Filesystem is predicted to run out of inodes within the next 4 hours."
    "expr": |
      (
        node_filesystem_files_free{job="node",fstype!=""} / node_filesystem_files{job="node",fstype!=""} * 100 < 20
      and
        predict_linear(node_filesystem_files_free{job="node",fstype!=""}[6h], 4*60*60) < 0
      and
        node_filesystem_readonly{job="node",fstype!=""} == 0
      )
    "for": "1h"
    "labels":
      "severity": "critical"
  - "alert": "NodeFilesystemAlmostOutOfFiles"
    "annotations":
      "description": "Filesystem on {{ $labels.device }} at {{ $labels.instance }} has only {{ printf \"%.2f\" $value }}% available inodes left."
      "summary": "Filesystem has less than 5% inodes left."
    "expr": |
      (
        node_filesystem_files_free{job="node",fstype!=""} / node_filesystem_files{job="node",fstype!=""} * 100 < 5
      and
        node_filesystem_readonly{job="node",fstype!=""} == 0
      )
    "for": "1h"
    "labels":
      "severity": "warning"
  - "alert": "NodeFilesystemAlmostOutOfFiles"
    "annotations":
      "description": "Filesystem on {{ $labels.device }} at {{ $labels.instance }} has only {{ printf \"%.2f\" $value }}% available inodes left."
      "summary": "Filesystem has less than 3% inodes left."
    "expr": |
      (
        node_filesystem_files_free{job="node",fstype!=""} / node_filesystem_files{job="node",fstype!=""} * 100 < 3
      and
        node_filesystem_readonly{job="node",fstype!=""} == 0
      )
    "for": "1h"
    "labels":
      "severity": "critical"
  - "alert": "NodeNetworkReceiveErrs"
    "annotations":
      "description": "{{ $labels.instance }} interface {{ $labels.device }} has encountered {{ printf \"%.0f\" $value }} receive errors in the last two minutes."
      "summary": "Network interface is reporting many receive errors."
    "expr": |
      rate(node_network_receive_errs_total[2m]) / rate(node_network_receive_packets_total[2m]) > 0.01
    "for": "1h"
    "labels":
      "severity": "warning"
  - "alert": "NodeNetworkTransmitErrs"
    "annotations":
      "description": "{{ $labels.instance }} interface {{ $labels.device }} has encountered {{ printf \"%.0f\" $value }} transmit errors in the last two minutes."
      "summary": "Network interface is reporting many transmit errors."
    "expr": |
      rate(node_network_transmit_errs_total[2m]) / rate(node_network_transmit_packets_total[2m]) > 0.01
    "for": "1h"
    "labels":
      "severity": "warning"
  - "alert": "NodeHighNumberConntrackEntriesUsed"
    "annotations":
      "description": "{{ $value | humanizePercentage }} of conntrack entries are used."
      "summary": "Number of conntrack are getting close to the limit."
    "expr": |
      (node_nf_conntrack_entries / node_nf_conntrack_entries_limit) > 0.75
    "labels":
      "severity": "warning"
  - "alert": "NodeTextFileCollectorScrapeError"
    "annotations":
      "description": "Node Exporter text file collector failed to scrape."
      "summary": "Node Exporter text file collector failed to scrape."
    "expr": |
      node_textfile_scrape_error{job="node"} == 1
    "labels":
      "severity": "warning"
  - "alert": "NodeClockSkewDetected"
    "annotations":
      "description": "Clock on {{ $labels.instance }} is out of sync by more than 300s. Ensure NTP is configured correctly on this host."
      "summary": "Clock skew detected."
    "expr": |
      (
        node_timex_offset_seconds > 0.05
      and
        deriv(node_timex_offset_seconds[5m]) >= 0
      )
      or
      (
        node_timex_offset_seconds < -0.05
      and
        deriv(node_timex_offset_seconds[5m]) <= 0
      )
    "for": "10m"
    "labels":
      "severity": "warning"
  - "alert": "NodeClockNotSynchronising"
    "annotations":
      "description": "Clock on {{ $labels.instance }} is not synchronising. Ensure NTP is configured on this host."
      "summary": "Clock not synchronising."
    "expr": |
      min_over_time(node_timex_sync_status[5m]) == 0
      and
      node_timex_maxerror_seconds >= 16
    "for": "10m"
    "labels":
      "severity": "warning"
  - "alert": "NodeRAIDDegraded"
    "annotations":
      "description": "RAID array '{{ $labels.device }}' on {{ $labels.instance }} is in degraded state due to one or more disks failures. Number of spare drives is insufficient to fix issue automatically."
      "summary": "RAID Array is degraded"
    "expr": |
      node_md_disks_required - ignoring (state) (node_md_disks{state="active"}) > 0
    "for": "15m"
    "labels":
      "severity": "critical"
  - "alert": "NodeRAIDDiskFailure"
    "annotations":
      "description": "At least one device in RAID array on {{ $labels.instance }} failed. Array '{{ $labels.device }}' needs attention and possibly a disk swap."
      "summary": "Failed device in RAID array"
    "expr": |
      node_md_disks{state="failed"} > 0
    "labels":
"severity": "warning"此告警规则 YAML 文件是使用 Node-exporter mixin 生成的。它默认使用 job=node 标签选择器查询指标。如果您需要使用不同的选择器,请在 config.libsonnet 中修改选择器,然后按照 mixin 仓库中的说明重新生成仪表盘。
本页内容
Grafana Cloud 带有不断扩展的集成集,可在几分钟内快速启动并运行可观测性技术栈。内置于 Grafana Agent 中的 Linux Node 集成会暴露并抓取必要的系统指标,然后将其推送到 Grafana Cloud。Agent 将使用嵌入式 Node Exporter 抓取指标,Grafana Cloud 将自动配置量身定制的 Grafana 仪表盘和告警,用于可视化和处理这些数据。
要了解更多信息,请查看 Grafana Cloud 文档。
工作原理
配置、安装、连接和维护 Prometheus 监控组件通常需要大量的领域知识。从设置到仪表盘和告警可能需要相当长的时间。作为 Grafana 的创建者以及 Prometheus 和 Cortex 的核心贡献者,我们构建简单的集成来抽象掉其中一部分工作,以便快速入门。工作原理:
- 注册(或登录)一个免费的 Grafana Cloud 账户。
- 选择您想要观测的目标(目录正在不断扩展)。
- 运行一行命令即可安装 Grafana Agent。Agent 嵌入并预配置 Exporters 以暴露默认指标,并将其推送到 Grafana Cloud 指标后端。
- 瞧!您将看到量身定制的 Grafana 仪表盘,并将受益于合理的默认告警设置。
正在寻找不同的 Exporter 或集成?查看我们的不断增长的流行组件集成库,例如 MySQL、Postgres、Redis、Memcached 等等。