
Elasticsearch Exporter
本页内容
简介
以下快速入门提供了 Elasticsearch Exporter 的设置说明以及预配置的仪表盘、告警规则和记录规则。完成本快速入门中的步骤后,您将拥有:
已安装并配置 Elasticsearch Exporter,以收集 Elasticsearch 指标,如集群状态、活动分片、JVM 指标、Elasticsearch 负载。Elasticsearch Exporter 将以 Prometheus 格式暴露这些指标。
已配置 Prometheus 以抓取 Elasticsearch Exporter 指标,并可选择将其发送到 Grafana Cloud。
已设置一组预配置和精选的记录规则,以缓存频繁的 Prometheus 查询。
已导入 Grafana 仪表盘以可视化您的指标数据。
已设置 Prometheus 告警规则以根据您的指标数据进行告警。
指标使用量
此导出器默认发布约 392 个 Prometheus 时间序列。要查看此导出器默认发布的指标列表,请在此处下载示例指标抓取文件。
请注意,根据其配置,Elasticsearch Exporter 可能会收集和发布远超此默认集的指标。要了解有关配置 Elasticsearch Exporter 和切换其收集器的更多信息,请参阅 Elasticsearch Exporter 的GitHub 仓库。
除了切换 Elasticsearch Exporter 的设置,您还可以通过丢弃不需要存储在 Prometheus 或 Grafana Cloud 中的时间序列来减少指标使用量。要了解如何执行此操作,请参阅 Grafana Cloud 文档中的使用 relabeling 减少 Prometheus 指标使用量。
Grafana Cloud 的 Elasticsearch 集成
如果您使用 Grafana Cloud,可以通过安装 Elasticsearch Exporter 集成来跳过本指南中的所有步骤,该集成旨在通过几个命令和点击帮助您快速启动和运行。免费注册。
要了解如何使用 Elasticsearch Exporter 集成设置 Elasticsearch Exporter,请参阅 Grafana Cloud 文档中的Elasticsearch Exporter 集成。
本页内容
Elasticsearch Exporter 快速入门
在本指南中,您将学习如何设置和配置 Elasticsearch Exporter 以收集 Elasticsearch 指标,如集群状态、活动分片、JVM 指标、Elasticsearch 负载,并以 Prometheus 格式暴露它们。然后,您将配置 Prometheus 以抓取 Elasticsearch 指标,并可选择将其发送到 Grafana Cloud。最后,您将设置一组预配置和精选的记录规则、Grafana 仪表盘和告警规则。完成本指南后,您将获得可用于可视化 Elasticsearch 指标的仪表盘,以及一组预配置的告警。
如果您使用Grafana Cloud,Elasticsearch 集成可以帮助您快速启动和运行。Elasticsearch 集成将 Elasticsearch Exporter 嵌入到 Grafana Cloud Agent 中,并自动配置告警规则和仪表盘,因此您无需执行本指南中的步骤。要了解如何使用 Elasticsearch 集成设置 Elasticsearch Exporter,请参阅 Grafana Cloud 文档中的Elasticsearch 集成。
前提条件
在开始之前,您应该准备好以下各项:
- 一台兼容 Elasticsearch Exporter 版本的机器。要查看可用版本的列表,请参阅发布页面。
- 在您的机器上运行的 Elasticsearch。要了解有关安装和运行 Elasticsearch 的更多信息,请参阅Elasticsearch 安装指南。
- 在您的环境或直接在机器上运行的 Prometheus。要了解如何安装 Prometheus,请参阅 Prometheus 文档中的安装。
- 在您的环境或直接在机器上运行的 Grafana。要了解如何安装 Grafana,请参阅 Grafana 文档中的安装 Grafana。
- (可选)Grafana Cloud 帐户。Grafana Cloud 托管 Grafana 和基于 Mimir 的 Prometheus 指标端点。您仍然需要使用在您的环境中安装的 Prometheus 或 Grafana Cloud Agent 抓取指标。要了解有关 Grafana Cloud 的更多信息,请参阅Grafana Cloud。
步骤 1:设置 Elasticsearch Exporter
在此步骤中,您将在您的机器上设置 Elasticsearch exporter,以 Prometheus 格式收集并暴露 Elasticsearch 指标。本指南使用带有 Elasticsearch 7.12.0 的 Ubuntu 20.04 系统。步骤可能会因您的操作系统和 Elasticsearch 版本而略有不同。
首先,登录到您的机器并下载相应的 Elasticsearch Exporter 二进制文件。本指南使用 linux-amd64 二进制文件,但您应选择与您的系统操作系统和架构对应的文件:
wget https://github.com/justwatchcom/elasticsearch_exporter/releases/download/v1.1.0/elasticsearch_exporter-1.1.0.linux-amd64.tar.gz将 v1.1.0 替换为您要安装的版本。本指南可能会过时,因此最好查看 Elasticsearch Exporter 发布页面以获取最新的稳定版本。
解压 tar 包并 cd 到目录:
tar xvfz elasticsearch_exporter-1.1.0.linux-amd64.tar.gz
cd elasticsearch_exporter-1.1.0.linux-amd64如果您在同一台 Linux 机器上运行 Elasticsearch,您的 Elasticsearch 端点将是 https://:9200。根据您的设置,这可能有所不同,并且可以使用 --es.uri 标志进行设置。
最后,运行 exporter:
./elasticsearch_exporter --es.uri="https://:9200"
level=info ts=2021-03-31T10:39:42.180223026Z caller=clusterinfo.go:200 msg="triggering initial cluster info call"
level=info ts=2021-03-31T10:39:42.180423443Z caller=clusterinfo.go:169 msg="providing consumers with updated cluster info label"
level=info ts=2021-03-31T10:39:42.18398451Z caller=main.go:148 msg="started cluster info retriever" interval=5m0s
level=info ts=2021-03-31T10:39:42.184156478Z caller=main.go:188 msg="starting elasticsearch_exporter" addr=:9114如果您看到上述输出,则表示您已成功运行 Elasticsearch Exporter。
Elasticsearch Exporter 在端口 9114 上以 Prometheus 格式发布 Elasticsearch 指标。您可以使用 curl 进行测试。您需要打开新的 SSH 会话或将 Elasticsearch Exporter 进程放入后台以使用 curl。
curl https://:9114/metrics# HELP elasticsearch_node_stats_up Was the last scrape of the ElasticSearch nodes endpoint successful.
# TYPE elasticsearch_node_stats_up gauge
elasticsearch_node_stats_up 1
# HELP elasticsearch_nodes_roles Node roles
# TYPE elasticsearch_nodes_roles gauge
elasticsearch_nodes_roles{cluster="es-docker-cluster",host="172.29.0.2",name="es01",role="client"} 1
elasticsearch_nodes_roles{cluster="es-docker-cluster",host="172.29.0.2",name="es01",role="data"} 1
elasticsearch_nodes_roles{cluster="es-docker-cluster",host="172.29.0.2",name="es01",role="ingest"} 1
elasticsearch_nodes_roles{cluster="es-docker-cluster",host="172.29.0.2",name="es01",role="master"} 1
# HELP elasticsearch_os_cpu_percent Percent CPU used by OS
# TYPE elasticsearch_os_cpu_percent gauge
elasticsearch_os_cpu_percent{cluster="es-docker-cluster",es_client_node="true",es_data_node="true",es_ingest_node="true",es_master_node="true",host="172.29.0.2",name="es01"} 0
# HELP elasticsearch_os_load1 Shortterm load average
# TYPE elasticsearch_os_load1 gauge
elasticsearch_os_load1{cluster="es-docker-cluster",es_client_node="true",es_data_node="true",es_ingest_node="true",es_master_node="true",host="172.29.0.2",name="es01"} 0
# HELP elasticsearch_os_load15 Longterm load average
# TYPE elasticsearch_os_load15 gauge
elasticsearch_os_load15{cluster="es-docker-cluster",es_client_node="true",es_data_node="true",es_ingest_node="true",es_master_node="true",host="172.29.0.2",name="es01"} 0.05
# HELP elasticsearch_os_load5 Midterm load average
# TYPE elasticsearch_os_load5 gauge
elasticsearch_os_load5{cluster="es-docker-cluster",es_client_node="true",es_data_node="true",es_ingest_node="true",es_master_node="true",host="172.29.0.2",name="es01"} 0
# HELP elasticsearch_os_mem_actual_free_bytes Amount of free physical memory in bytes
# TYPE elasticsearch_os_mem_actual_free_bytes gauge
elasticsearch_os_mem_actual_free_bytes{cluster="es-docker-cluster",es_client_node="true",es_data_node="true",es_ingest_node="true",es_master_node="true",host="172.29.0.2",name="es01"} 0如果您看到上述输出,则表示您已准备好开始使用 Prometheus 抓取 Elasticsearch 指标。
为了避免从命令行运行和管理 Elasticsearch Exporter,您可以创建一个 systemd 服务。要了解如何执行此操作,请参阅创建 systemd 服务来管理代理。将代理二进制文件的路径替换为 Elasticsearch Exporter 的路径。
Elasticsearch exporter 提供了分片级别统计、集群快照统计等功能。要了解有关这些功能的更多信息,请参阅Elasticsearch Exporter GitHub 仓库。
步骤 2:使用 Prometheus 抓取 Elasticsearch Exporter
现在 Elasticsearch Exporter 已在您的机器上运行,您可以配置一个 Prometheus 抓取任务来收集和存储 Elasticsearch Exporter 指标。
将以下抓取任务配置添加到您的 prometheus.yml 配置文件的 scrape_configs 部分:
- job_name: elasticsearch
  static_configs:
- targets: ['elasticsearch_exporter_machine_IP_address:9114']将 elasticsearch_exporter_machine_IP_address 替换为运行 Elasticsearch Exporter 的机器的 IP 地址。如果您在同一台机器上运行 Prometheus,这将是 localhost。要了解有关配置 Prometheus 的更多信息,请参阅 Prometheus 文档中的配置。
如果您没有 prometheus.yml 配置文件,请使用您喜欢的文本编辑器创建一个简单的文件。打开您偏好的文本编辑器并粘贴以下 Prometheus 配置:
global:
  scrape_interval: 15s

scrape_configs:
- job_name: elasticsearch
  static_configs:
- targets: ['elasticsearch_exporter_machine_IP_address:9114']此配置告诉 Prometheus 每 15 秒抓取所有任务。唯一配置的抓取任务名为 elasticsearch,并定义了 elasticsearch_exporter_machine_IP_address:9114 目标。默认情况下,Prometheus 将使用 HTTP 抓取 /metrics 端点。
保存并关闭文件。然后您可以使用以下命令运行带有该文件的 Prometheus:
./prometheus --config.file=./prometheus.yml将指标发送到 Grafana Cloud
要从 Prometheus 将 MySQL Exporter 指标发送到 Grafana Cloud,请在您的 prometheus.yml 配置文件中配置 remote_write 参数。要了解更多信息,请参阅 Grafana Cloud 文档中的指标 — Prometheus。要了解有关 remote_write 参数的更多信息,请参阅 Prometheus 文档中的remote_write。
步骤 3:配置记录规则
使用记录规则,您可以预先计算和缓存经常查询的指标。例如,如果仪表盘面板使用计算密集型查询(如 rate()),您可以创建一个记录规则,以较低的固定间隔运行并将密集型查询的结果保存在新的时间序列中。这避免了每次刷新仪表盘时都抓取和计算数据。要了解有关 Prometheus 记录规则的更多信息,请参阅 Prometheus 文档中的记录规则。
在本指南中加载仪表盘之前,您应加载以下记录规则。仪表盘查询和告警规则使用记录规则来减少 Prometheus 或 Grafana Cloud Metrics 服务器的负载,具体取决于您评估规则的位置。
您可以在此处获取记录规则 YAML 文件。
此记录规则 YAML 文件是使用 Elasticsearch Exporter mixin 生成的。
将记录规则加载到 Prometheus
要将记录规则加载到 Prometheus,请将以下内容添加到您的 prometheus.yml 配置文件中:
rule_files:
- "elasticsearch_exporter_recording_rules.yml"请务必将 elasticsearch_exporter_recording_rules.yml 替换为您 Elasticsearch Exporter 记录规则 YAML 文件的路径。
将记录规则加载到 Grafana Cloud
要了解如何将记录规则加载到 Grafana Cloud,请参阅使用 cortextool 管理 Prometheus 和 Loki 规则。
步骤 4:配置仪表盘
本快速入门包含一个仪表盘:
- Elasticsearch 概览
要了解如何将这些仪表盘导入 Grafana,请参阅 Grafana 文档中的导入仪表盘。
这些仪表盘查询可能依赖于上一步中定义的记录规则。请务必在导入仪表盘之前导入这些规则。
您可以在此处获取仪表盘。
步骤 5:配置告警
使用 Prometheus 告警规则,您可以定义当 PromQL 表达式超过某个阈值或在一段时间内满足指定条件时触发的告警。例如,您可以定义一个 HighRequestLatency 告警,当请求延迟指标在一段时间内大于某个阈值时触发。告警条件一旦触发,告警将进入 Pending 状态。在满足 for 参数定义的时间段条件后,告警将进入 Firing 状态。您可以使用 Alertmanager 等工具配置触发告警的路由和通知。Alertmanager 也内置于 Grafana Cloud 中。
您可以在此处获取告警规则 YAML 文件。
将告警规则加载到 Prometheus
要将告警规则加载到 Prometheus,请将以下内容添加到您的 prometheus.yml 配置文件中:
rule_files:
- "elasticsearch_exporter_alerting_rules.yml"请务必将 elasticsearch_exporter_alerting_rules.yml 替换为您 Elasticsearch 告警规则 YAML 文件的路径。
将告警规则加载到 Grafana Cloud
要了解如何将告警规则加载到 Grafana Cloud,请参阅使用 cortextool 管理 Prometheus 和 Loki 规则。
结论
在本快速入门中,您在 Linux 机器上安装并运行了 Elasticsearch Exporter。然后,您配置了 Prometheus 来抓取 Elasticsearch Exporter 暴露的数据库和 Elasticsearch 指标。您将记录规则和告警规则加载到 Prometheus 中,最后导入 Grafana 仪表盘来可视化您的 Elasticsearch 指标。
如果您使用 Grafana Cloud,可以通过安装带有 Grafana Cloud Agent 的 Elasticsearch 集成来跳过本指南中的所有步骤。此集成将预配置的 Elasticsearch Exporter 嵌入到代理中,并自动配置 Grafana 仪表盘以及 Prometheus 告警和记录规则,因此您无需手动导入它们。要了解如何设置 Elasticsearch 集成,请参阅Grafana Cloud 集成。
这些仪表盘、记录规则和告警规则是使用 Elasticsearch Exporter Mixin 生成的。Mixin 是由主题专家精心策划和设计的仪表盘、记录规则和告警的可重用模板。要了解更多信息,请参阅Elasticsearch Mixin 仓库。
本页内容
在本指南中加载仪表盘之前,您应加载以下记录规则。仪表盘查询使用记录规则来减少 Prometheus 或 Grafana Cloud Metrics 服务器的负载,具体取决于您评估规则的位置。
本快速入门包含以下记录规则:
elasticsearch_process_cpu_highelasticsearch_os_cpu_highelasticsearch_yellow_cluster_statuselasticsearch_red_cluster_statuselasticsearch_filesystem_data_used_percentelasticsearch_filesystem_data_free_percentelasticsearch_node_disk_watermark_reachedelasticsearch_heap_utilization_percentage
groups:
- name: elasticsearch_rules
  rules:
  - record: elasticsearch_filesystem_data_free_percent
    expr: 100 - elasticsearch_filesystem_data_used_percent

  - record: elasticsearch_red_cluster_status
    expr: sum by (cluster) (elasticsearch_cluster_health_status == 2)

  - record: elasticsearch_yellow_cluster_status
    expr: sum by (cluster) (elasticsearch_cluster_health_status == 1)

  - record: elasticsearch_process_cpu_high
    expr: sum by (cluster, instance, name) (elasticsearch_process_cpu_percent)

  - record: elasticsearch_os_cpu_high
    expr: sum by (cluster, instance, name) (elasticsearch_os_cpu_percent)

  - record: elasticsearch_filesystem_data_used_percent
    expr: sum by (cluster, instance, name) (
      100 * (elasticsearch_filesystem_data_size_bytes - elasticsearch_filesystem_data_free_bytes)
      / elasticsearch_filesystem_data_size_bytes)

  - record: elasticsearch_node_disk_watermark_reached
    expr: sum by (cluster, instance, name) (round(
          (1 - (elasticsearch_filesystem_data_available_bytes / elasticsearch_filesystem_data_size_bytes)
        ) * 100, 0.001))

  - record: elasticsearch_heap_utilization_percentage
    expr: sum by (cluster, instance, name) (
100 * (elasticsearch_jvm_memory_used_bytes{area="heap"} / elasticsearch_jvm_memory_max_bytes{area="heap"}))此记录规则 YAML 文件是使用 Elasticsearch Exporter mixin 生成的。
本页内容
注意:这些仪表盘可能依赖于上一选项卡中的记录规则。请务必在导入仪表盘之前导入这些规则。
Elasticsearch 概览仪表盘
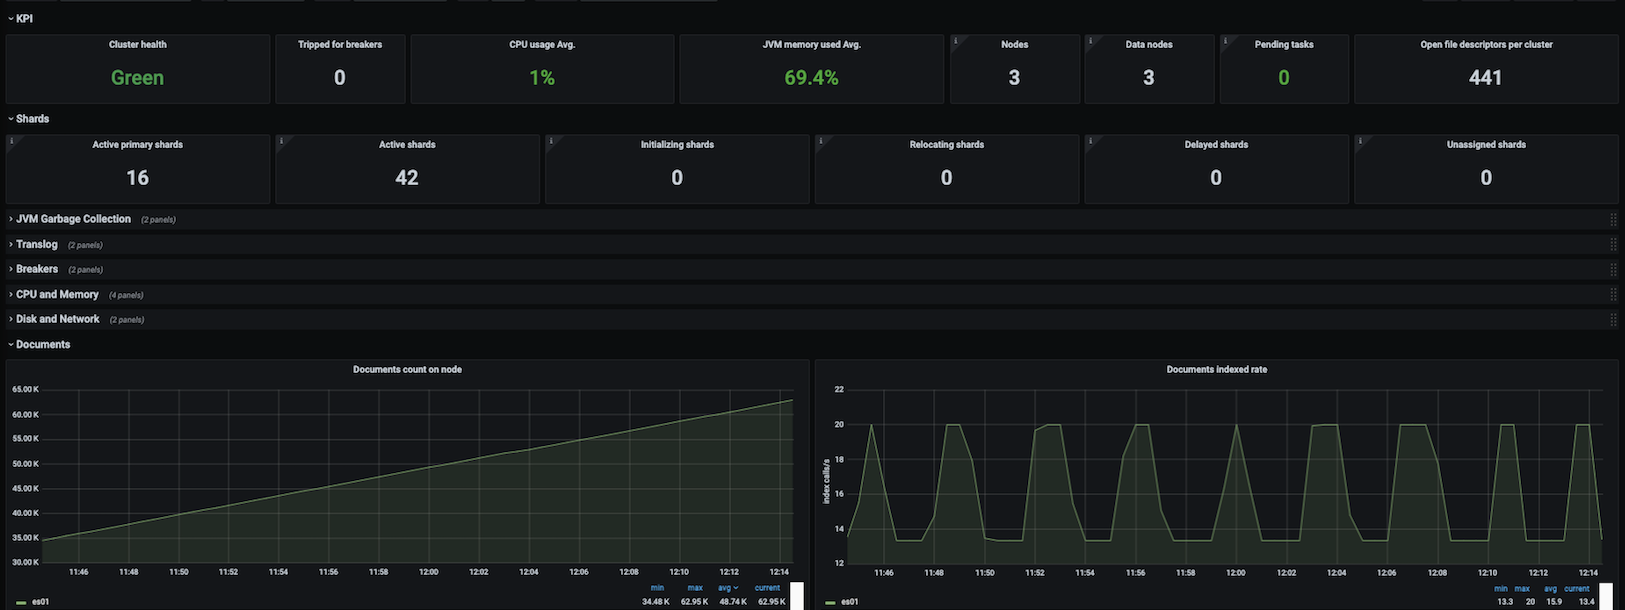
此仪表盘包含以下指标的面板:
- 集群健康
- CPU 和内存
- 磁盘使用量
- 网络使用量
- 平均负载
- JVM 内存使用量
- JVM 垃圾收集
- 断路器触发次数
- 节点
- 待处理任务
- 每集群打开文件描述符数
- 活动主分片
- 活动、初始化、迁移和延迟分片
- Translog
- 断路器
- 文档总数和大小
- 节点上的文档计数
- 文档索引、删除和合并速率
- 文档合并字节数
- 查询、索引和合并时间
- 索引存储的限制时间
- 总操作速率、时间和统计信息
- 线程池
- 缓存
- 段
您可以使用以下仪表盘 ID 直接导入仪表盘:14191
您可以在此处获取仪表盘 JSON 文件。
此仪表盘是使用 Elasticsearch Exporter mixin 生成的。
本页内容
本快速入门包含以下告警规则:
ElasticsearchTooFewNodesRunning
运行的 Elasticsearch 节点少于预期
ElasticsearchHeapTooHigh
堆利用率过高
ElasticsearchClusterNotHealthy
Elasticsearch 集群状态为 Yellow 或 Red
ElasticsearchNodeDiskWatermarkReached
磁盘可用存储空间不足
ElasticsearchProcessCPUHigh
Elasticsearch 进程占用了过多的 CPU
SystemCPUHigh
Elasticsearch 节点占用了过多的 CPU
下载以下告警规则 YAML 文件:groups:
- name: elasticsearch-alerts
rules:
- alert: ElasticsearchTooFewNodesRunning
expr: elasticsearch_cluster_health_number_of_nodes < 3
for: 5m
annotations:
description: "There are only {{ $value }} < 3 ElasticSearch nodes running"
summary: ElasticSearch running on less than 3 nodes
labels:
severity: critical
- alert: ElasticsearchHeapTooHigh
expr: elasticsearch_heap_utilization_percentage > 90
for: 15m
annotations:
description: The heap usage is over 90% for 15m
summary: "ElasticSearch node {{ $labels.name }} heap usage is high"
labels:
severity: critical
- alert: ElasticsearchClusterNotHealthy
expr: elasticsearch_red_cluster_status
for: 2m
annotations:
message: "Cluster {{ $labels.cluster }} health status has been RED for at least 2m. Cluster does not accept writes, shards may be missing or master node hasn't been elected yet."
summary: Cluster health status is RED
labels:
severity: critical
- alert: ElasticsearchClusterNotHealthy
expr: elasticsearch_yellow_cluster_status
for: 20m
annotations":
message": "Cluster {{ $labels.cluster }} health status has been YELLOW for at least 20m. Some shard replicas are not allocated."
summary": Cluster health status is YELLOW
labels:
severity: warning
- alert: ElasticsearchNodeDiskWatermarkReached
expr: elasticsearch_node_disk_watermark_reached > 85
for: 5m
annotations:
message: "Disk Low Watermark Reached at {{ $labels.node }} node in {{ $labels.cluster }} cluster. Shards can not be allocated to this node anymore. You should consider adding more disk to the node."
summary: "Disk Low Watermark Reached - disk saturation is {{ $value }}%"
labels:
severity: warning
- alert: ElasticsearchNodeDiskWatermarkReached
expr: elasticsearch_node_disk_watermark_reached > 90
for: 5m
annotations:
message: "Disk High Watermark Reached at {{ $labels.node }} node in {{ $labels.cluster }} cluster. Some shards will be re-allocated to different nodes if possible. Make sure more disk space is added to the node or drop old indices allocated to this node."
summary: "Disk High Watermark Reached - disk saturation is {{ $value }}%"
labels:
severity: critical
- alert: ElasticsearchJVMHeapUseHigh
expr: elasticsearch_heap_utilization_percentage > 75
for: 10m
annotations:
message: "JVM Heap usage on the node {{ $labels.node }} in {{ $labels.cluster }} cluster is {{ $value }}%."
summary: JVM Heap usage on the node is high
labels:
severity: critical
- alert: SystemCPUHigh
expr: elasticsearch_os_cpu_high > 90
for: 1m
annotations":
message: "System CPU usage on the node {{ $labels.node }} in {{ $labels.cluster }} cluster is {{ $value }}%"
summary: System CPU usage is high
labels:
severity: critical
- alert: ElasticsearchProcessCPUHigh
expr: elasticsearch_process_cpu_high > 90
for: 1m
annotations:
message: "ES process CPU usage on the node {{ $labels.node }} in {{ $labels.cluster }} cluster is {{ $value }}%"
summary: ES process CPU usage is high
labels:
severity: critical此告警规则 YAML 文件是使用 Elasticsearch Exporter mixin 生成的。
本页内容
Grafana Cloud 提供了一系列不断扩展的集成,可帮助您在几分钟内快速启动和运行可观测性栈。Elasticsearch 集成内置于 Grafana Cloud Agent 中,它暴露并抓取关键的 Elasticsearch 指标,并将其推送到 Grafana Cloud。代理将使用嵌入式 Elasticsearch Exporter 抓取指标,Grafana Cloud 将自动配置定制的 Grafana 仪表盘和告警,用于可视化和处理这些数据。
要了解更多信息,请查阅Grafana Cloud 文档。
工作原理
配置、安装、连接和维护 Prometheus 监控组件通常需要大量的领域知识。从设置到仪表盘和告警可能需要相当长的时间。作为 Grafana 的创建者以及 Prometheus 和 Cortex 的核心贡献者,我们构建了简单的集成来抽象掉部分工作,以便快速入门。工作原理:
- 免费注册(或登录)Grafana Cloud 帐户。
- 选择您想要观测的目标(一个不断扩展的目录)。
- 运行一行命令即可安装 Grafana Agent。该代理嵌入并预配置 Exporter 以暴露默认指标,并将其推送到 Grafana Cloud 指标后端。
- 看!您将看到定制的 Grafana 仪表盘,并可受益于合理的默认告警。
正在寻找其他 Exporter 或集成?查阅我们不断增长的流行组件集成库,例如 MySQL、Postgres、Redis、Memcached 等。