
插件 〉AWS X-Ray

AWS X-Ray
兼容性
由于 UI 组件的重大变更,Grafana AWS X-Ray 数据源插件 >=2.13.0 与 Grafana <10.4.x 版本不兼容。
X-Ray 数据源
X-Ray 数据源插件提供对 AWS X-Ray 的支持。将其添加为数据源,然后您就可以构建仪表板或使用 Explore 功能查看 X-Ray 中的追踪、分析或洞察。
添加数据源
- 在侧边菜单的Configuration(配置)链接下,点击Data Sources(数据源)。
- 点击Add data source(添加数据源)按钮。
- 在Distributed tracing(分布式追踪)部分选择X-Ray。
注意:如果您在使用此数据源时遇到问题,并且 Grafana 给出不明确的错误,请检查您的日志文件(/var/log/grafana/grafana.log)。
| 名称 | 描述 |
|---|---|
| 名称 | 数据源名称。您可以通过此名称在面板和查询中引用该数据源。 |
| 默认 | 默认数据源表示它将为新面板预选。 |
| 默认区域 | 用于查询编辑器中设置区域。(可在每次查询时更改) |
| 身份验证提供商 | 指定获取凭证的提供商。 |
| 凭证配置文件名 | 指定要使用的配置文件名称(如果您使用 ~/.aws/credentials 文件),留空则使用默认配置。 |
| Assume Role Arn | 指定要代入的角色的 ARN。 |
| 外部 ID | 如果您要代入在另一个帐户中创建并带外部 ID 的角色,请在此处指定外部 ID。 |
身份验证
在本节中,我们将介绍可用于 AWS X-Ray 数据源的不同身份验证类型。
IAM 角色
目前,对 X-Ray 的所有访问都是通过 Grafana 后端使用官方 AWS SDK 在服务器端完成的。如果您的 Grafana 服务器运行在 AWS 上,您可以使用 IAM 角色,身份验证将自动处理。
请参阅 AWS 文档了解 IAM 角色
注意:AWS 角色切换 目前不受支持。
IAM 策略
Grafana 需要通过 IAM 授予权限才能读取 X-Ray 数据以及 EC2 标签/实例/区域。您可以将这些权限附加到 IAM 角色,并利用 Grafana 内置的代入角色支持。
这是一个基本的策略示例
{
  "Version": "2012-10-17",
  "Statement": [
    {
      "Effect": "Allow",
      "Action": [
        "xray:BatchGetTraces",
        "xray:GetTraceSummaries",
        "xray:GetTraceGraph",
        "xray:GetGroups",
        "xray:GetTimeSeriesServiceStatistics",
        "xray:GetInsightSummaries",
        "xray:GetInsight",
        "xray:GetServiceGraph",
        "ec2:DescribeRegions"
      ],
      "Resource": "*"
    }
  ]
}
示例 AWS 凭证
如果身份验证提供商是 Credentials file(凭证文件),Grafana 会按以下顺序尝试获取凭证
- 硬编码凭证
- 环境变量(
AWS_ACCESS_KEY_ID和AWS_SECRET_ACCESS_KEY) - 现有默认配置文件
- ~/.aws/credentials
- 用于 Amazon EC2 的 IAM 角色
请参阅 AWS 文档中的 配置适用于 Go 的 AWS 开发工具包 获取更多信息。
AWS 凭证文件
在 ~/.aws/credentials 处创建一个文件。这是运行 grafana-server 的用户的主目录路径。
注意:如果凭证文件位于正确的目录中,但仍无法工作,请尝试将您的 .aws 文件移动到 '/usr/share/grafana/'。确保您的凭证文件权限至多为 0644。
示例凭证文件
[default]
aws_access_key_id = <your access key>
aws_secret_access_key = <your access key>
region = us-west-2
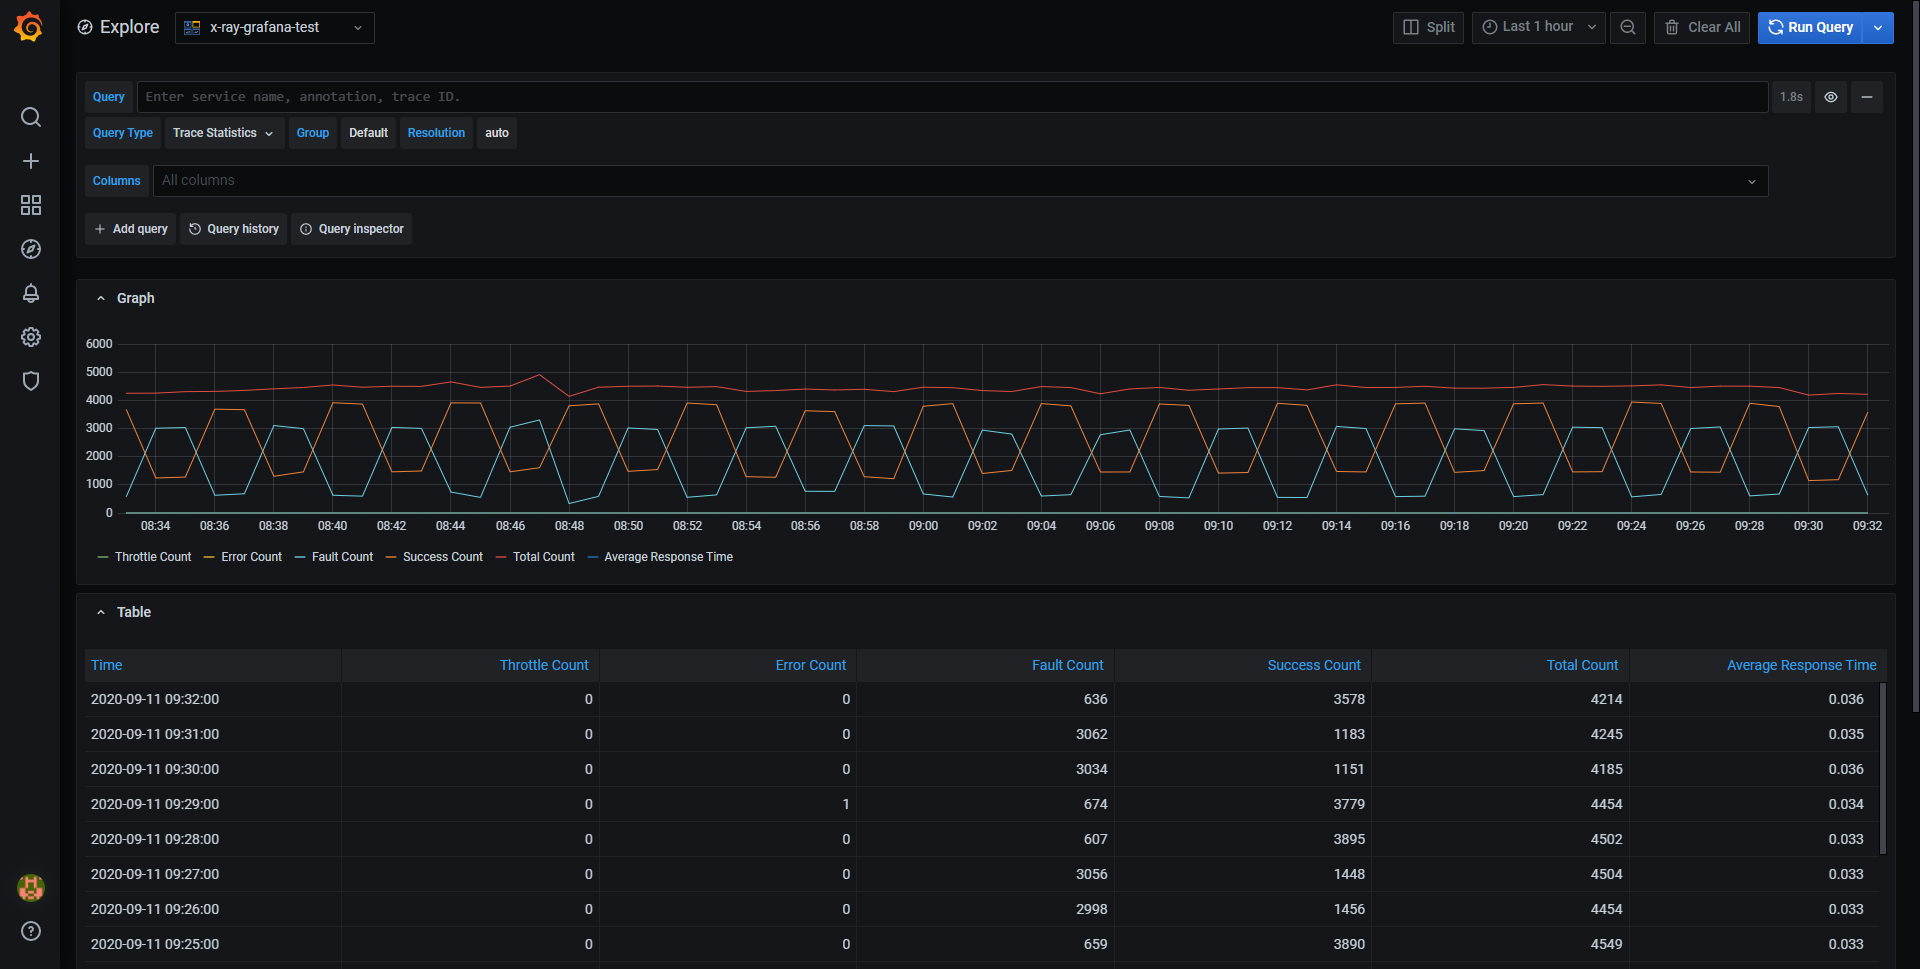
查询编辑器
查询编辑器中最重要的字段是查询类型。共有五种查询类型
- 追踪列表 (AWS 中的 Traces)
- 追踪统计
- 追踪分析 (AWS 中的 Analytics)
- 洞察
- 服务地图

追踪列表
追踪列表类型允许您搜索以表格形式显示的追踪。点击第一列中的 trace id 可以在右侧打开追踪详情。请注意编辑器中的查询字段。您可以编写查询、过滤表达式或插入单个追踪 ID,它们将显示在追踪视图中。您可以在 AWS X-Ray 文档 中找到有关过滤表达式的更多详细信息。

注意:追踪列表最多只显示前 1000 个追踪。
追踪统计
在追踪统计中,您可以看到一个图表和一个表格,显示有关错误、故障、限流、成功和总计数的信息。您可以在查询编辑器中使用 columns 字段只显示指定的列。
追踪分析
在追踪分析中,您可以可视化以下表格
- 根本原因
- 响应时间
- 根本原因服务(路径中的最后一个服务)
- 路径(多个路径)
- 错误
- 根本原因服务(路径中的最后一个服务)
- 路径
- 错误消息
- 故障
- 根本原因服务(路径中的最后一个服务)
- 路径
- 错误消息
- 响应时间
- 终端用户影响
- URL
- HTTP 状态码
洞察
在洞察中,您可以看到洞察的汇总表。点击 InsightId 将带您进入 AWS 控制台。
服务地图
Grafana 中的服务地图使客户能够查看使用微服务架构构建的应用地图。地图上的每个节点都代表一个服务,例如 AWS Lambda 函数、在 API Gateway 上运行的 API 或 DynamoDB 表。借助此地图,客户可以轻松检测任何服务中的性能问题,或错误、故障或限流率的增加,并深入研究相应的追踪和根本原因。

服务地图查询类型显示的数据与 X-Ray 控制台中的服务地图相同。
显示服务地图
您可以使用按钮或鼠标平移和缩放视图。有关可视化的详细信息,请参阅 节点图面板。

与 X-ray 根节点类似,服务地图中代表客户端应用的节点位于地图的左侧。
地图中的每个服务都表示为一个圆圈。内部数字显示每笔事务的平均时间和每分钟事务数。
服务周围的彩色圆圈也与 X-ray 控制台中的颜色和含义相符,表示请求的百分比。
- 绿色 = 成功
- 红色 = 故障
- 黄色 = 错误
- 紫色 = 限流响应
点击服务或边框,即可看到一个包含链接的上下文菜单,这些链接可快速导航到 X-ray 中的其他相关信息。您可以使用这些链接快速导航到特定服务的所有错误追踪列表,然后继续查看特定追踪。
有关服务地图的更多信息,请参阅官方 AWS X-ray 文档。
警报
由于 X-Ray 查询可以返回数字数据,因此支持警报。请参阅 警报 文档,了解更多关于 Grafana 警报的信息。
定价
使用 AWS X-Ray,没有前期费用或承诺。您只需按实际使用量付费,基于记录、检索和扫描的追踪数量。每月首次检索或扫描的 1,000,000 个追踪是免费的。超出免费层,扫描的追踪每 100 万个追踪收费 0.50 美元(每个追踪 0.0000005 美元)。更多详情请参阅 X-Ray 定价页面。
通过配置管理配置数据源
您可以使用 Grafana 的配置管理系统通过配置文件配置数据源。有关其工作原理和所有可用设置的更多信息,请参阅 配置 Grafana。
以下是一些此数据源的配置示例。
使用凭证文件
如果您使用凭证文件身份验证类型,请使用类似以下的配置
apiVersion: 1
datasources:
name: X-Ray
type: grafana-x-ray-datasource
jsonData:
authType: credentials
defaultRegion: eu-west-2
使用 accessKey 和 secretKey
apiVersion: 1
datasources:
name: X-Ray
type: grafana-x-ray-datasource
jsonData:
authType: keys
defaultRegion: eu-west-2
secureJsonData:
accessKey: ‘<your access key>’
secretKey: ‘<your secret key>’
跨账户可观测性
X-Ray 插件允许您通过跨账户可观测性功能监控同一区域内多个 AWS 账户的追踪。使用跨账户可观测性,您可以无缝搜索、可视化和分析 AWS 追踪,而无需担心账户边界问题。
开始使用
要启用跨账户可观测性,首先使用官方 CloudWatch 文档 在 AWS 中启用该功能,然后将 两个 API 操作 添加到运行该插件的角色/用户附加的 IAM 策略中。
此功能目前由 cloudWatchCrossAccountQuerying 功能开关控制。
您可以通过配置文件或环境变量启用功能开关。详情请参阅配置文档 ({{< relref "../setup-grafana/configure-grafana/#feature_toggles" >}})。Grafana Cloud 用户可以通过 在 Cloud Portal 中开启支持工单 获取此功能。
按账户 ID 过滤追踪
启用该功能后,您将能够显示跨多个账户的追踪,并按账户 ID 过滤这些追踪。当您在 Grafana 中选择 Service Map 查询类型时,将显示一个账户下拉列表,其中填充了所选时间范围内返回的追踪中显示的账户 ID。
您还可以在追踪列表查询类型中将账户 ID 添加为查询过滤表达式的一部分。
在 Grafana Cloud 上安装 AWS X-Ray
在 Grafana Cloud 实例上安装插件只需一键操作;更新也是如此。很棒吧?
请注意,可能需要长达 1 分钟才能在您的 Grafana 中看到该插件。
在 Grafana Cloud 实例上安装插件只需一键操作;更新也是如此。很棒吧?
请注意,可能需要长达 1 分钟才能在您的 Grafana 中看到该插件。
在 Grafana Cloud 实例上安装插件只需一键操作;更新也是如此。很棒吧?
请注意,可能需要长达 1 分钟才能在您的 Grafana 中看到该插件。
在 Grafana Cloud 实例上安装插件只需一键操作;更新也是如此。很棒吧?
请注意,可能需要长达 1 分钟才能在您的 Grafana 中看到该插件。
在 Grafana Cloud 实例上安装插件只需一键操作;更新也是如此。很棒吧?
请注意,可能需要长达 1 分钟才能在您的 Grafana 中看到该插件。
在 Grafana Cloud 实例上安装插件只需一键操作;更新也是如此。很棒吧?
请注意,可能需要长达 1 分钟才能在您的 Grafana 中看到该插件。
在 Grafana Cloud 实例上安装插件只需一键操作;更新也是如此。很棒吧?
请注意,可能需要长达 1 分钟才能在您的 Grafana 中看到该插件。
更多信息,请访问关于 插件安装 的文档。
在本地 Grafana 上安装
对于本地实例,插件通过简单的 CLI 命令进行安装和更新。插件不会自动更新,但当有更新可用时,您会在 Grafana 中收到通知。
1. 安装数据源
使用 grafana-cli 工具从命令行安装 AWS X-Ray
grafana-cli plugins install 插件将安装到您的 grafana 插件目录中;默认路径为 /var/lib/grafana/plugins。关于 cli 工具的更多信息。
2. 配置数据源
通过 Grafana 主菜单访问,新安装的数据源可以直接在数据源部分添加。
接下来,点击右上角的 Add data source(添加数据源)按钮。该数据源将在Type(类型)选择框中可用。
要查看已安装数据源的列表,请点击主菜单中的Plugins(插件)项。核心数据源和已安装数据源都会显示。
更新日志
本项目的所有重要变更都将记录在此文件中。
2.13.2
- 在 #313 中将 github.com/grafana/grafana-plugin-sdk-go 更新到 v0.265.0
- 在 #307 中更新 all-go-dependencies 组(1 个目录,3 次更新)
- Chore: 在 #303 中更新 e2e 测试工作流程
- 在 #288 中将 go_modules 组中的 golang.org/x/crypto 从 0.30.0 升级到 0.31.0
2.13.1
- 在 #301 中更新 readme 以包含兼容性信息
2.13.0
2.12.0
- 在 #289 中更新 all-node-dependencies 组(19 次更新)
- 在 #283 中更新 all-go-dependencies 组(1 个目录,4 次更新)
- 在 #286 中为响应添加开始时间
2.11.0
- 在 #275 中更新 all-node-dependencies 组(1 个目录,31 次更新)
- 在 #274 中将 npm_and_yarn 组中的 nanoid 从 3.3.7 升级到 3.3.8
- 在 #269 中更新 all-go-dependencies 组(1 个目录,4 次更新)
- 在 #271 中将 npm_and_yarn 组中的 cross-spawn 从 7.0.3 升级到 7.0.6
- 在 #260 中将 npm_and_yarn 组中的 path-to-regexp 从 1.8.0 升级到 1.9.0
- 在 #262 中更新 all-go-dependencies 组(1 个目录,3 次更新)
- 在 #259 中将 npm_and_yarn 组中的 micromatch 从 4.0.7 升级到 4.0.8
- 在 #255 中更新 all-github-action-dependencies 组(2 次更新)
- 在 #258 中将 npm_and_yarn 组中的 webpack 从 5.93.0 升级到 5.94.0
- 升级 grafana-plugin-sdk-go (deps): 在 #252 中将 github.com/grafana/grafana-plugin-sdk-go 从 0.252.0 升级到 0.255.0
- Chore: 在 #251 中更新依赖项
- Chore: 在 #250 中更新 plugin.json 关键词
- 在 #247 中更新插件名称以匹配亚马逊约定
2.10.1
- chore: 在 #245 中添加 errorsource
- Chore: 在 #243 中重命名数据源文件
- 添加 pre-commit 钩子,包含 lint 和拼写检查 #242
- precommit 钩子使用 yarn 而非 cspell #246
2.10.0
- Chore: 在 #240 中更新依赖项
2.9.1
- 由 @idastambuk 在 #235 中将配置和查询编辑器迁移到新的表单样式
2.9.0
- 修复:由 @kevinwcyu 在 #228 中传递空数组以查询所有列
- 由 @katebrenner 在 #226 中为 issues 添加 stalebot
- 由 @iwysiu 在 #232 中更新以使用 datasource.Manage 和 sessions.GetSessionWithAuthSettings
- 修复:在 #236 中使用 ReadAuthSettings 获取 authSettings
2.8.3
- 更新 CONTRIBUTING.md 以包含发布说明
- 引入 go 1.21.8 中的安全修复程序
2.8.2
- 在 https://github.com/grafana/x-ray-datasource/pull/220 中将 grafana/aws-sdk-go 更新到 0.20.0
2.8.1
- 由 @dependabot 在 https://github.com/grafana/x-ray-datasource/pull/208 中将 go.opentelemetry.io/contrib/instrumentation/net/http/httptrace/otelhttptrace 从 0.37.0 升级到 0.44.0
- 由 @dependabot 在 https://github.com/grafana/x-ray-datasource/pull/212 中将 google.golang.org/grpc 从 1.58.2 升级到 1.58.3
- 由 @dependabot 在 https://github.com/grafana/x-ray-datasource/pull/218 中将 go.opentelemetry.io/contrib/instrumentation/google.golang.org/grpc/otelgrpc 从 0.45.0 升级到 0.46.0
- 由 @fridgepoet 在 https://github.com/grafana/x-ray-datasource/pull/217 中升级 underscore, d3-color, debug, cosmiconfig, yaml 依赖项
完整更新日志:https://github.com/grafana/x-ray-datasource/compare/v2.8.0...v2.8.1
2.8.0
将 ConfigEditor 和 QueryEditor 迁移到新的表单样式 #211
在 #210 中将 google.golang.org/grpc 从 1.54.0 升级到 1.56.3
在 201 中支持 Node 18
2.7.2
- 由 @jamesrwhite 在 https://github.com/grafana/x-ray-datasource/pull/203 中修复 X-Ray 服务地图过滤追踪列表查询
2.7.1
- 更新 @grafana/aws-sdk 以修复临时凭证中的一个错误
2.7.0
- 更新 grafana-aws-sdk 到 v0.19.1 以将
il-central-1添加到选择加入区域列表
2.6.2
2.6.1
- 更新 grafana-aws-sdk 版本以在选择加入区域列表中包含新区域 https://github.com/grafana/grafana-aws-sdk/pull/80
- 安全:构建过程中的 Go 版本升级到 1.20.4
- 更新 grafana-plugin-sdk-go 版本到 0.161.0,以避免潜在的 http 头部问题。https://github.com/grafana/athena-datasource/issues/233
2.6.0
- 更新后端依赖项
2.5.0
- 由 @kevinwcyu 在 https://github.com/grafana/x-ray-datasource/pull/173 中添加 SQL 到追踪
2.4.0
- 由 @sunker 在 https://github.com/grafana/x-ray-datasource/pull/158 中添加拼写检查并修复拼写错误
- 由 @iwysiu 在 https://github.com/grafana/x-ray-datasource/pull/148 中迁移到 create-plugin
- 由 @idastambuk 在 https://github.com/grafana/x-ray-datasource/pull/162 中更新代码覆盖率工作流程
- 由 @kevinwcyu 在 https://github.com/grafana/x-ray-datasource/pull/164 中更新 @grafana/aws-sdk
- 依赖项:由 @idastambuk 在 https://github.com/grafana/x-ray-datasource/pull/167 中将 @grafana 依赖项更新到 9.3.2
- 小型重构:由 @sarahzinger 在 https://github.com/grafana/x-ray-datasource/pull/169 中仅在服务地图页面获取账户 ID
- 由 @fridgepoet 在 https://github.com/grafana/x-ray-datasource/pull/171 中将 grafana-aws-sdk 升级到 v0.12.0
完整更新日志:https://github.com/grafana/x-ray-datasource/compare/v2.2.0...v2.4.0****
2.3.0
- 功能:在 https://github.com/grafana/x-ray-datasource/pull/157 中支持按账户 ID 过滤
2.2.0
- 将
SummaryStatistics的属性设为可选
2.1.2
- 安全:构建过程中的 Go 版本升级到 1.19.3
2.1.1
- 安全:构建过程中的 Go 版本升级到 1.19.2
2.1.0
- 由 @dependabot 在 https://github.com/grafana/x-ray-datasource/pull/130 中将 terser 从 4.8.0 升级到 4.8.1
- 由 @iwysiu 在 https://github.com/grafana/x-ray-datasource/pull/132 中修复带有变量的追踪列表
- 由 @fridgepoet 在 https://github.com/grafana/x-ray-datasource/pull/139 中升级到 grafana-aws-sdk v0.11.0
完整更新日志: https://github.com/grafana/x-ray-datasource/compare/v2.0.1...v2.1.0
v.2.0.1
- 使用密钥进行身份验证的错误修复:https://github.com/grafana/x-ray-datasource/pull/128
- 代码覆盖率变更
- 代码所有者变更
v2.0.0
变更内容
- 由 @yaelleC 在 https://github.com/grafana/x-ray-datasource/pull/122 中停止支持低于
8.0.0的 Grafana 版本
错误修复
- 由 @iwysiu 在 https://github.com/grafana/x-ray-datasource/pull/115 中更新最低 IAM 策略
- 由 @fridgepoet 在 https://github.com/grafana/x-ray-datasource/pull/119 中修复 strings.Title 的已弃用用法
其他
- 由 @andresmgot 在 https://github.com/grafana/x-ray-datasource/pull/121 中更新 grafana-aws-sdk
v1.4.0
错误修复
其他
- 修改请求的 User-Agent。现在将遵循以下形式:
"aws-sdk-go/$aws-sdk-version ($go-version; $OS;) X-ray/$X-ray-version-$git-hash Grafana/$grafana-version"
v1.3.4
错误修复
其他
- 将 prismjs 从 1.23.0 升级到 1.24.0 #80
v1.3.3
其他
- 升级 grafana/aws-sdk 和 Grafana 依赖版本 #77
v1.3.2
功能 / 改进
v1.3.1
错误修复
- 移除不向后兼容的 API 使用,避免在 Grafana 7.4.0 之前使用 1.3.0 版本。 #67
其他
- 将 Grafana 依赖锁定在最新的稳定版本,防止 CI 中编译失败。 #68
v1.3.0
功能 / 改进
- 添加服务地图查询类型,允许以类似于 X-Ray 控制台的方式可视化服务地图数据。 #60
v1.2.0
功能 / 改进
- 更新插件配置页面中的身份验证设置,以包含 SDK 默认身份验证机制,并使用我们 Grafana 特定用于 AWS 的身份验证 SDK。 #59
v1.1.0
功能 / 改进
- 在查询编辑器中添加区域选择器。 #57
v1.0.1
- CI 自动发布所需的版本升级
v1.0.0
- 初次发布