
插件 〉Zabbix

Zabbix
适用于 Grafana 的 Zabbix 插件
![]()
![]()
![]()

功能特性
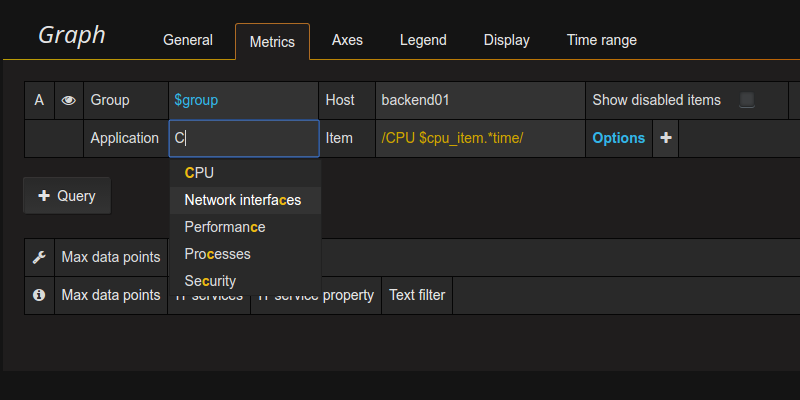
- 使用正则表达式选择多个指标
- 使用模板变量创建交互式和可重用仪表盘
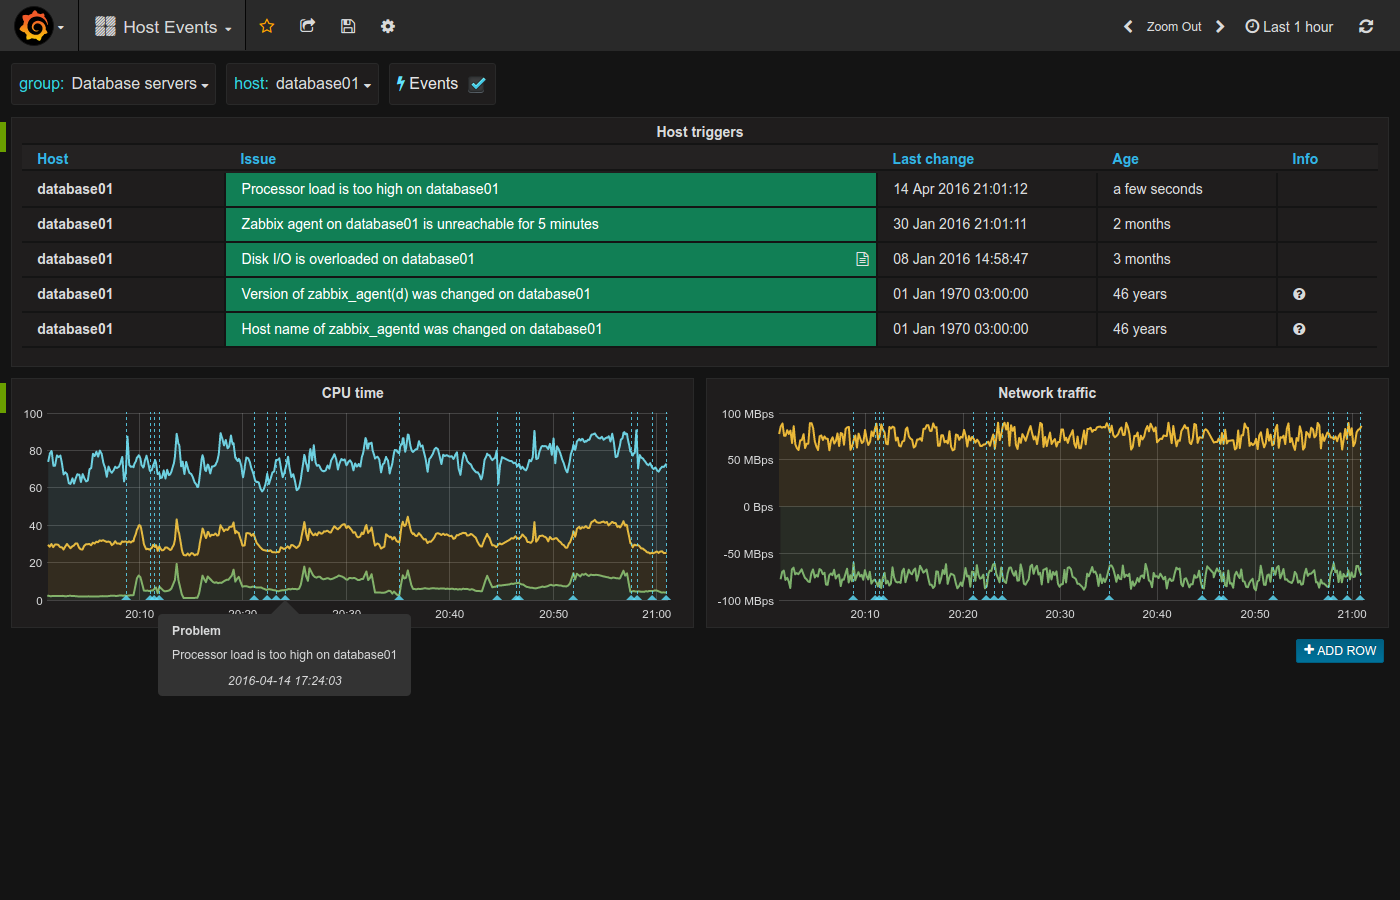
- 使用注释在图表上显示事件
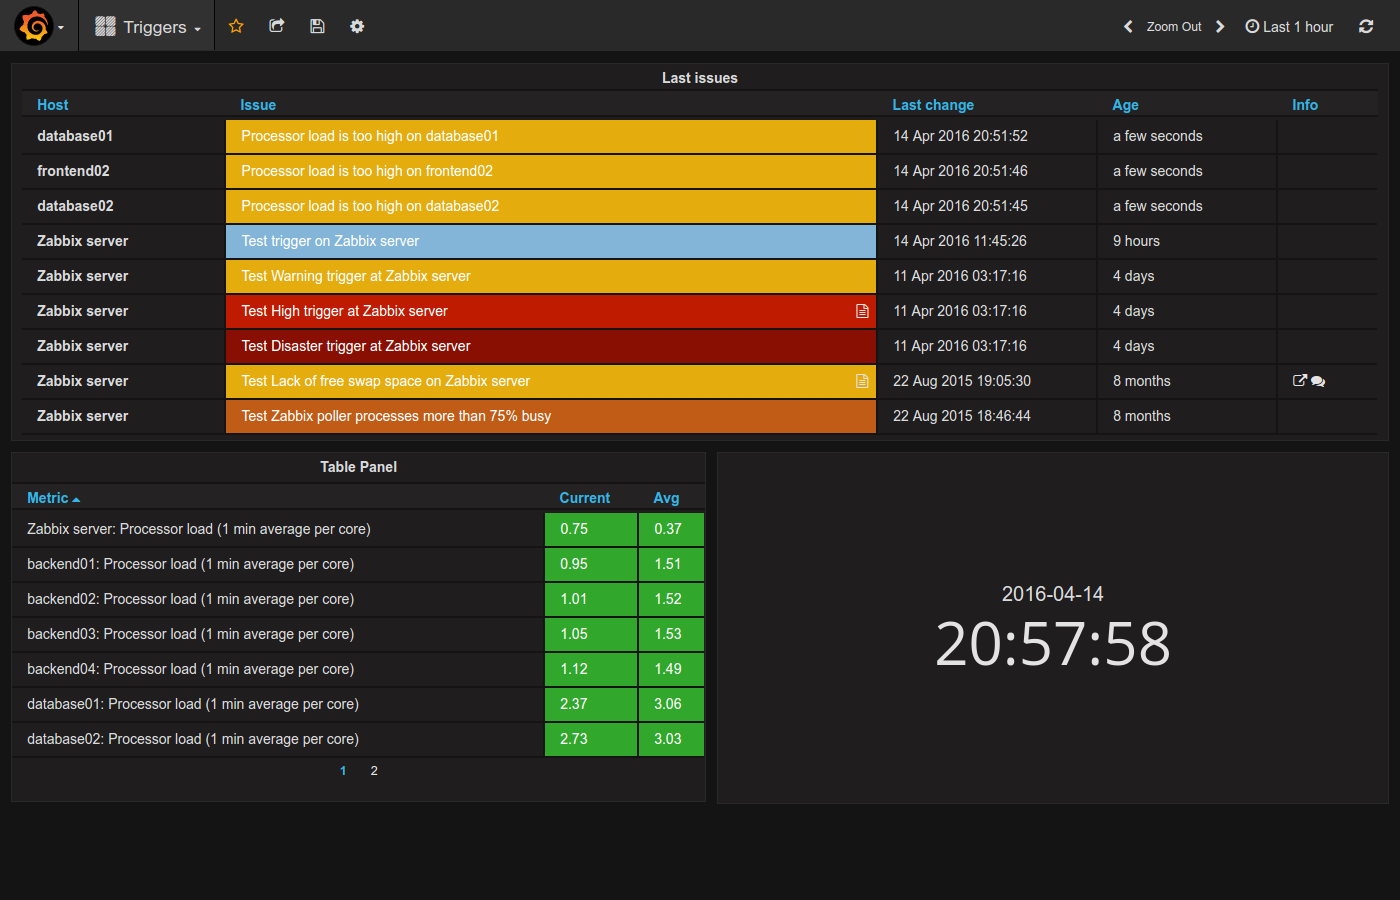
- 使用 Triggers 面板显示活动问题
- 使用指标处理函数(平均值、中位数、最小值、最大值、乘法、汇总、时间偏移、别名)转换和整形数据
- 使用报警功能更快地发现问题
- 在同一个仪表盘甚至图表中混合来自多个数据源的指标
- 在官方库中发现并分享仪表盘
在 Grafana-Zabbix 实时演示站点查看所有功能概述和仪表盘示例。访问 grafana.com 上的插件页面,查看可用的 Grafana 数据源、面板和仪表盘。
安装
使用 grafana-cli 安装
grafana-cli plugins install alexanderzobnin-zabbix-app
或在文档中查看更多安装选项。
入门
首先,配置 Zabbix 数据源。然后,您可以按照分步入门指南创建您的第一个仪表盘。
文档
社区资源、反馈和支持
- 发现了 Bug?想要新功能?请随时提交问题。
- 有疑问?您也可以提交问题,但对于疑问,最好使用Grafana 社区门户。
在 Grafana Cloud 上安装 Zabbix
在 Grafana Cloud 实例上安装插件只需一键操作;更新也一样。很棒吧?
请注意,插件可能需要最多 1 分钟才能在您的 Grafana 中显示。
在 Grafana Cloud 实例上安装插件只需一键操作;更新也一样。很棒吧?
请注意,插件可能需要最多 1 分钟才能在您的 Grafana 中显示。
在 Grafana Cloud 实例上安装插件只需一键操作;更新也一样。很棒吧?
请注意,插件可能需要最多 1 分钟才能在您的 Grafana 中显示。
在 Grafana Cloud 实例上安装插件只需一键操作;更新也一样。很棒吧?
请注意,插件可能需要最多 1 分钟才能在您的 Grafana 中显示。
在 Grafana Cloud 实例上安装插件只需一键操作;更新也一样。很棒吧?
请注意,插件可能需要最多 1 分钟才能在您的 Grafana 中显示。
在 Grafana Cloud 实例上安装插件只需一键操作;更新也一样。很棒吧?
请注意,插件可能需要最多 1 分钟才能在您的 Grafana 中显示。
在 Grafana Cloud 实例上安装插件只需一键操作;更新也一样。很棒吧?
请注意,插件可能需要最多 1 分钟才能在您的 Grafana 中显示。
有关更多信息,请访问关于插件安装的文档。
在本地 Grafana 上安装
对于本地实例,插件通过简单的 CLI 命令进行安装和更新。插件不会自动更新,但是当有可用更新时,您将在 Grafana 中收到通知。
1. 安装应用程序
使用 grafana-cli 工具从命令行安装 Zabbix
grafana-cli plugins install 插件将安装到您的 grafana 插件目录中;默认路径为 /var/lib/grafana/plugins。有关 cli 工具的更多信息。
2. 启用它
接下来,登录您的 Grafana 实例。导航到插件部分,该部分位于 Grafana 主菜单中。
在插件部分的 应用程序 选项卡中,单击并选择新安装的应用程序。
要启用该应用程序,请单击 配置 选项卡。按照应用程序提供的说明进行操作,然后单击启用。现在可以从主菜单中访问该应用程序以及任何新的 UI 页面,这些页面由应用程序创建者设计。
如果应用程序中包含仪表盘,它们将尝试自动安装。要查看仪表盘、重新导入或删除单个仪表盘,请单击应用程序页面内的 仪表盘 选项卡。
更新日志
5.0.4
🐛 修复:通过禁用 Go 中的后量子密钥交换机制来解决 TLS 握手超时问题
5.0.3
🐛 安全:将 golang.org/x/net 从 v0.35.0 更新到 v0.37.0 ⚙️ 例行维护:使用 Go 1.24.1 构建插件 🐛 修复:Zabbix <7.2 中的基本认证问题 ⚙️ 例行维护:将 grafana-plugin-sdk-go 版本从 0.270.0 提升到 0.274.0
[5.0.2] - 2025-02-27
- 例行维护:修复解析无效 JSON 响应的错误源
- 例行维护:更新 github.com/grafana/grafana-plugin-sdk-go 到 v0.268.0
[5.0.1] - 2025-02-24
- Bug 修复:修复了问题面板中不显示主机组的问题
- Bug 修复:修复了选择触发器时问题面板损坏的问题
- 例行维护:更新 github.com/grafana/grafana-plugin-sdk-go 到 v0.266.0
- 例行维护:更新前端依赖项
- 例行维护:实现错误源
[5.0.0] - 2025-01-10
- 插件现在需要 Grafana 10.4.8 或更高版本
[4.6.1] - 2025-01-07
- Bug 修复:修复了与 Zabbix 7 的兼容性问题。(修复 #1935)
[4.6.0] - 2024-12-16
- 功能:添加了对 Zabbix 7 的支持。(修复 #1914)
- 功能:主机 ID 别名函数
$__zbx_host_id(#1913) - Bug 修复:修复了混合数据源与变量引用不工作的问题 #1909
- Bug 修复:修复了多个 SLA 查询处理不正确的问题 #1910
- 例行维护:更新了 grafana 插件 SDK
[4.5.7] - 2024-10-30
- 例行维护:将 uplot 提升到 1.6.31
- 例行维护:将 grafana-plugin-sdk-go 版本从 0.250.0 提升到 0.251.0
[4.5.6] - 2024-10-21
- 修复:grafana 11.0.0 中的 AlertList 样式问题
- 例行维护:迁移示例仪表盘,弃用旧面板
[4.5.5] - 2024-09-30
- 例行维护:将 dompurify 版本从 3.1.0 提升到 3.1.6
- 例行维护:将 grafana-plugin-sdk-go 版本从 0.250.0 提升到 0.251.0
- 例行维护:将 grafana-plugin-sdk-go 版本从 0.247.0 提升到 0.250.0
[4.5.4] - 2024-09-12
- 例行维护:将 path-to-regexp 版本从 1.8.0 提升到 1.9.0
- 例行维护:将 grafana-plugin-sdk-go 版本从 0.236.0 提升到 0.247.0
[4.5.3] - 2024-09-03
- 例行维护:将 fast-loops 版本从 1.1.3 提升到 1.1.4
- 例行维护:将 webpack 版本从 5.88.2 提升到 5.94.0
- 例行维护:将 micromatch 版本从 4.0.5 提升到 4.0.8
- 文档:更新别名函数文档
[4.5.2] - 2024-07-01
- 例行维护:嵌套插件所需的更改
- 例行维护:更新了可执行文件路径
[4.5.1] - 2024-06-14
- 修复:Zabbix 7 版本之前问题查询不工作的问题
[4.5.0] - 2024-06-10
- 添加对 Zabbix 7 版本的支持
[4.4.9] - 2024-04-30
- 修复:提高与场景框架的兼容性 (#1822)
- 例行维护:更新依赖项
[4.4.8] - 2024-04-15
- 例行维护:更新依赖项
[4.4.7] - 2024-04-08
- 例行维护:将 grafana-plugin-sdk-go 版本从
v0.193.0提升到v0.220.0 - 例行维护:更新插件关键字
[4.4.6] - 2024-03-07
- 修复:API token 重置不工作 (#1797)
- 例行维护:使用 Go 1.22 构建
[4.4.5] - 2024-01-10
- ⚙️ 文档:文档网站已从 github pages 迁移至 grafana.com/docs/plugins 页面
- 处理 PostgreSQL 插件 ID 更改 #1771
[4.4.4] - 2023-11-21
功能特性
- 更新配置页面以遵循最佳实践
修复
- 配置中不显示仪表盘的问题
例行维护
- 添加了 lint github 工作流程
- 更新 grafana-plugin-sdk-go 到最新版本
- 移除旧式表单样式
[4.4.3] - 2023-10-10
例行维护
- 不跟踪仪表盘上的请求 #1707
[4.4.2] - 2023-10-09
例行维护
文档
- 修复查询编辑器和文档中的断开链接 #1701
[4.4.1] - 2023-08-30
已修复
- 插件不可用,#1604
[4.4.0] - 2023-08-17
已添加
已修复
[4.3.1] - 2023-03-23
已修复
- 无法创建或编辑变量(发生意外错误),#1590
- 项目标签过滤器工作不正常,#1594
- Grafana 和 Zabbix 中的 SLA 日期不同,#1595
- 问题面板:列表布局下无效的问题上次更改时间,#1596
- 问题面板:标签过滤器在历史模式下不工作,#1592
[4.3.0] - 2023-03-21
已添加
- Zabbix 6.0 中的 SLA 支持,#1437
- 构建适用于 FreeBSD,#1301
- 问题面板:添加操作数据,#1260
- 问题面板:允许在问题描述中使用 HTML,#1557
- 问题面板:在消息中显示确认作者,#1281
- 问题面板:查询具有特定严重性的问题,#572
- 当未选择“显示维护主机”时,显示来自维护主机中未被抑制的问题,#830
- 在触发器查询模式下设置数据帧名称,#1441
- 按图表使用趋势数据,#1442
- 改进了项目标签的性能,#1315
- 触发器查询模式:添加时间范围切换器,#918
已修复
- Zabbix 认证在 6.4 版本中不工作,#1544
- 错误
json: invalid use of ,string struct tag, trying to unmarshal into float64,#1325 - 触发器:已确认过滤器不工作,#985
[4.2.10] - 2022-09-01
已修复
- 任何过滤器都不再接受 Perl 正则表达式语法,#1264
- InfluxDB 直接数据库连接错误(
this.influxDS._seriesQuery(...).then is not a function),#1255
[4.2.9] - 2022-07-12
已修复
- 插件与 Zabbix 6.2.0 不兼容,#1470
[4.2.8] - 2022-05-06
已修复
[4.2.7] - 2022-05-04
已修复
- IT 服务与 Zabbix 6.0 不兼容,#1408
- 问题面板:标签只有名称时出现
Cannot read properties of undefined (reading 'trim')错误,#1420 - 仪表盘未包含在插件中,#1407
- 响应中缺少标签,#1352
- 找不到主机时查询返回所有应用程序数据,#1427
- 基本认证不工作 (401 Unauthorized),#1327
- “显示禁用项目”选项不起作用,#1249
[4.2.6] - 2022-04-04
已修复
- 问题面板:当“问题事件生成模式”设置为“多个”时,问题名称不正确,#1403
[4.2.5] - 2022-02-17
已修复
- 问题面板:尝试点击信息按钮时出错,#1357
- 解析 regexp 错误:无效或不支持的 Perl 语法,#1318
- json:无法将数字反序列化到 Go struct 字段 TimeSeriesData.series.TS 的 int64 类型中,#1320
- json:无法将数字反序列化到 Go struct 字段 QueryModel.queryType 的 string 类型中,#1342
- Grafana 在 4.2 中无法从 Zabbix 获取单位,#1321
[4.2.4] - 2021-09-27
已修复
[4.2.3] - 2021-09-21
已修复
- 不同采集间隔兼容性问题(堆叠图问题),#1211
- 使用趋势数据时图表损坏,#1300
- Zabbix API 请求错误“EOF”,#1295
- 项目标签不接受变量,#1283
- 查询数据失败,rpc 错误,#1262
- 创建变量模板查询时出错
Cannot read property 'isZabbix54OrHigher' of undefined,#1282
[4.2.2] - 2021-08-25
已修复
- 不同项目间隔兼容性问题(堆叠图问题),#1211
- 随机出现“Failed to call resource”错误和插件重启,#1269
- 如果系列数小于提供的 N,Top 函数不起作用,#1267
- 多选时(正则表达式)不显示主机名,#1265
- 无法将数字反序列化到 Go struct 字段 ZabbixDatasourceSettingsDTO.timeout 的 string 类型中,#1254
sortSeries()不按系列名称排序,#1274
[4.2.1] - 2021-08-10
已修复
- 使用聚合函数的查询没有数据
- 百分位聚合错误
[4.2.0] - 2021-08-10
已添加
已修复
- 直接数据库连接 - Grafana 8.0 中没有数据,#1221
- 在 Grafana 8.0 中尝试确认问题时出错,#1239
- 问题视图中的“探索”按钮不起作用(重定向到 404),#1240
- Zabbix 值映射在 Grafana 8.0 中不起作用,#1222
- 如果问题有标签,无法看到确认信息,#1233
- 在窄布局中看不到确认按钮,#1252
[4.1.5] - 2021-05-18
已修复
- 修复与 Zabbix 5.4 的兼容性问题,#1188
[4.1.4] - 2021-03-09
已修复
[4.1.3] - 2021-03-05
已修复
- 探索:错误“Unexpected field length”,#1150
- 问题:项目最新值文本被截断,#1145
- 问题:轻微的 UI 错误,#1149
- 在查询中禁用 zabbix 值映射转换的选项,#1128
[4.1.2] - 2021-01-28
已修复
[4.1.1] - 2020-12-30
已修复
- 包含依赖项的图表渲染失败,#1123
[4.1.0] - 2020-12-28
已添加
- Data Frames 支持,#10820。这解决了以下各种问题
- 如果可能,使用 Zabbix 中配置的单位
- 使用 Zabbix 中的值映射
- 对齐每个系列中的点,以防止堆叠图问题
- 用 null 值填充缺失的点,#1109
- 问题:按时间范围过滤问题,#1094
- ARM 构建 (ARM64 和 ARM v6),#1028
已修复
- Grafana 不阻止保存包含模板变量的告警,#1100
- 查询检查器不起作用,#1097
- 问题面板查询编辑器问题,#988
- 问题:无法将严重性更改为“未分类”,#1104
- 问题:确认消息限制为 64 个字符,#1122
[4.0.2] - 2020-11-13
已修复
- 查询模式 Text 不返回最新值数据,#1062
- 能够配置 API 请求超时,#1046
- 后端请求支持基本身份验证,#1048
- 问题:修复使用 null 值作为过滤器时出现空问题列表的问题
- 问题:修复显示过长的项目值的问题
[4.0.1] - 2020-09-02
已修复
- 插件未签名,#1038
- 数据源:“解析错误 Invalid JSON. An error occurred on the server while parsing the JSON text”,#1004
- 数据源:跳过 TLS 验证按钮不起作用,#1029
- 配置:在 Grafana 7.1.5 中无法选择直接数据库连接,#1027
- 问题:触发器依赖项未解决,#1024
[4.0.0] - 2020-08-25
4.0 功能亮点
Grafana-Zabbix 4.0 在底层带来了许多变化。最重要的一点是引入了后端,这带来了许多好处
- 告警支持(有限,数据处理函数暂不支持)。
- 修复了将数据源凭据暴露给 Grafana 前端以及将密码明文存储在数据库中的安全问题。
- 性能提升(插件可以在后端缓存查询和处理数据)。
- 随着安全性的提升,可以更容易地添加动作(执行脚本、关闭问题等)。
安装
前提条件:插件需要 Grafana 7.0 才能运行。
使用 grafana-cli 工具从命令行安装 Zabbix
grafana-cli plugins install alexanderzobnin-zabbix-app- 未签名插件默认不加载,请在 Grafana 配置文件中允许加载
allow_loading_unsigned_plugins = alexanderzobnin-zabbix-datasource - 重启 Grafana 服务器
请参阅allow_loading_unsigned_plugins 选项说明以获取更多信息。
安全性
已添加
已修复
- 问题:问题历史记录
- 问题:按严重性排序,#921
- 数据源:请求出错时重新连接
- 问题:按标签过滤
- 问题:排序顺序
- 问题:性能改进(移除不必要的查询)
- 问题:空问题列表,#955
- 问题:面板选项未打开时的面板迁移问题(重新加载后选项未保存)
- 问题:项目值工具提示位置
已移除
- 旧的告警功能(在面板上显示心形图标),已被 Grafana 告警取代
[4.0.0-alpha4] - 2020-07-21
已修复
- 问题:按标签过滤
- 问题:排序顺序
- 问题:性能改进(移除不必要的查询)
[4.0.0-alpha3] - 2020-07-17
已修复
- 问题:空问题列表,#955
[4.0.0-alpha2] - 2020-06-18
已修复
- 问题:面板选项未打开时的面板迁移问题(重新加载后选项未保存)
- 问题:项目值工具提示位置
已添加
- 问题:使用面板选项中的严重性过滤器
已移除
- 旧的告警功能(在面板上显示心形图标),已被 Grafana 告警取代
[4.0.0-alpha1] - 2020-06-04
4.0 功能亮点
Grafana-Zabbix 4.0 在底层带来了许多变化。最重要的一点是引入了后端,这带来了许多好处
- 告警支持(有限,数据处理函数暂不支持)。
- 修复了将数据源凭据暴露给 Grafana 前端以及将密码明文存储在数据库中的安全问题。
- 性能提升(插件可以在后端缓存查询和处理数据)。
- 随着安全性的提升,可以更容易地添加动作(执行脚本、关闭问题等)。
安装
前提条件:插件需要 Grafana 7.0 才能运行。
版本 4.0 目前处于 Alpha 阶段,尚未发布到 grafana.com。要安装它,请按照以下步骤操作
- 转到GitHub 版本页面并找到最新的
4.0.0版本。 - 从版本资源中下载插件
.zip包(资源名称为grafana-zabbix-4.0.0-<alphaX|betaX>.zip)。 - 解压并放到 grafana plugins 文件夹中。
- 未签名插件默认不加载,因此请在配置中允许加载
allow_loading_unsigned_plugins = alexanderzobnin-zabbix-datasource - 重启 Grafana 服务器
请参阅allow_loading_unsigned_plugins 选项说明以获取更多信息。
安全性
已添加
[3.12.2] - 2020-05-28
已修复
[3.12.1] - 2020-05-25
已修复
- 问题:面板出现错误(cannot read property 'description' of undefined),#954
- 问题:问题名称过滤器不起作用,#962
- 问题:已确认过滤器不起作用,#961
[3.12.0] - 2020-05-21
已添加
- 变量:能够查询项目值,#417
- 函数:向别名函数暴露主机、项目、应用,#619
- 问题:导航到“探索”并显示该问题的图表,#948
- 问题:能够显示问题/最新问题/历史记录,#495
- 问题:带有确认计数的图标,#946
- IT 服务:支持 SLA 间隔,#885
已修复
- “探索”与 Zabbix 数据源一起使用时不起作用,#888
- SLA 值不正确,#885
- 图表面板随机显示无数据,#861
- 变量:在 Grafana 7.0.0 中无法编辑变量,#949
- 变量:重复行内的变量范围错误,#912
- 问题:解析 URL 中的宏,#190
- 问题:无法确认已解决的问题,#942
- 问题:已解决问题的颜色和严重性设置为“未分类”,#909
- 问题:无法在仅包含单个问题的面板中确认告警,#900
- 注解:
ITEM.VALUE在注解中表现得像ITEM.LASTVALUE,#891 - 面板上的告警状态(心形图标)在 Grafana 6.7 中不起作用,#931
- 使用直接数据库连接时,合并平均值不准确,#752
已更改
[3.11.0] - 2020-03-23
已添加
已修复
[3.10.5] - 2019-12-26
已添加
已修复
- 问题面板:查询编辑器在 Grafana 6.4 中损坏,#817
- 数据源:函数编辑器不起作用,#810
- 数据源:无法从类型提示中添加函数到查询,#468
- 数据源:注解编辑器在 Grafana 6.x 中损坏,#813
- React 插件问题,#823
[3.10.4] - 2019-08-08
已修复
[3.10.3] - 2019-07-26
已修复
- 直接数据库连接:无法保持启用状态,#731
- 触发器查询模式:count 与 Singlestat 一起使用时不起作用,#726
- 查询编辑器:函数编辑器在 Grafana 6.x 中看起来很奇怪,#765
- 告警:Grafana 6.x 面板上的心形图标,#715
[3.10.2] - 2019-04-23
已修复
- 直接数据库连接:已配置的数据源加载失败,#711
- 函数:
sumSeries与其他聚合函数一起使用时不起作用,#530 - 问题面板:性能和内存问题,#720,#712
- 问题面板:对只读用户隐藏确认按钮,#722
- 问题面板:字体大小增加时,“无数据”会与表格标题重叠,#717
- 问题面板:问题描述不调整问题栏大小,#704
- 触发器查询模式:问题未按选定组过滤,#709
[3.10.1] - 2019-03-05
已修复
- 问题面板:在 Grafana 6.0 中无法编辑面板,#685
- 问题面板:数据源选择器为空,#692
- 问题面板:“已确认”过滤器不起作用,#678 #691
- 问题面板:已确认颜色不起作用,#676
- 问题面板:列表视图中已解决事件的背景高亮显示不正确,#681
- 问题面板:页面大小条目重复,#696
- 直接数据库连接:无法从 InfluxDB 获取趋势数据,#675
- 当时间设置为完整的一天/一周/一个月时,不显示注解,#680
- 启用直接数据库连接的数据源配置失败 #688
- 函数:
offset函数在 singlestat 面板中返回NaN,#683 - 函数:
median()与aggregateBy(median)不一致,#690 - 文档:添加关于安装方法的警告,#693
[3.10.0] - 2019-02-14
已添加
- 问题(原触发器)面板的表格状布局,#673
- 问题面板:能够显示仪表盘时间范围内的最新问题,#550
- 问题面板:按事件标签过滤问题,#487
- 问题面板:显示组和代理的选项,#418
- 支持 InfluxDB 作为直接数据库连接数据源,#640,与 Gleb Ivanovsky (又名 @i-ky) 合作
- 支持启用直接数据库连接的数据源配置,#614
- 函数:
offset函数,#387,鸣谢 @drakosha - 函数:
removeAboveValue、removeBelowValue、transformNull函数,#562,鸣谢 @gelonsoft
已修复
- 添加新指标时出现 *t.replace is not a function* 错误,#661
- 问题面板:在 Zabbix 4.0 中确认问题时出错,#629
- 问题面板:直接链接渲染的图片,#605
- 直接数据库连接:未返回系列时出现 *Cannot read property 'name' of null* 错误,#571
- 直接数据库连接:
consolidateBy(sum)工作不正常,#603 - 直接数据库连接:
consolidateBy()影响面板中其他指标,#602
已更改
- 禁用自动创建 Zabbix/Linux Server 仪表盘(仍可从数据源配置页面导入),#422
- 使用 Webpack 构建插件,#632
- 仓库中移除了
dist/文件夹,无法再从 github 仓库安装,#693
[3.9.1] - 2018-05-02
已修复
[3.9.0] - 2018-03-23
已添加
已修复
[3.8.1] - 2017-12-21
已修复
- 触发器面板多目标 bug(在一个目标中输入会影响其他目标)
- 触发器面板事件源图标
[3.8.0] - 2017-12-20
已添加
- 触发器面板支持多个数据源,#431
已更改
- 触发器面板已完全重新设计,关闭了大量问题:#431, #488, #299, #485, #412, #157, #483, #487, #248
- 测试已迁移到 Jest
已修复
- 触发器面板刷新问题
- aggregateBy() 函数 bug,#498
[3.7.0] - 2017-10-24
已添加
- 直接数据库连接支持 PostgreSQL。
Triggers查询模式,允许按组、主机和应用程序统计活动告警,#141sortSeries()函数,允许按名称对多个时间序列进行排序,#447,鸣谢 @mdorenkamppercentile()函数,鸣谢 @pedrohrfZabbix System Status示例仪表盘。
已更改
- 包含的仪表盘已移至数据源。转到数据源配置页面导入。
已修复
- 启用
ONLY_FULL_GROUP_BY选项时,直接数据库连接不起作用,#445 - 应用程序选择不起作用,#352
- 没有数据点且使用聚合函数时出现“data points outside time range”错误
- Grafana 4.5+ 中缺少“最大数据点”选项
- Grafana 4.5+ 中缺少查询编辑器帮助
- 使用 `<=` `>=` `=` 运算符检测告警阈值,鸣谢 @akotynski。
[3.6.1] - 2017-07-26
已修复
- 升级后出现 *cannot read property 'enable' of undefined* 错误,#436
[3.6.0] - 2017-07-26
已添加
- 直接数据库连接,允许使用现有 SQL 数据源直接从 Zabbix 数据库查询历史数据。
- 文档:直接数据库连接参考和配置。
consolidateBy函数,允许为时间序列数据指定聚合函数。movingAverage和exponentialMovingAverage函数。Item ID编辑器模式,用于按 ID 查询项目。
已更改
- IT 服务查询编辑器。现在用户可以使用正则表达式选择多个服务,#415
已修复
[3.5.1] - 2017-07-10
已修复
- 使用模板查询时的告警 bug,#424
[3.5.0] - 2017-07-05
已添加
rate()函数,计算增长计数器的每秒速率。- 时间序列函数基准测试。使用了 Benchmark.js 库。
已更改
- 模板查询格式。新格式为
{group}{host}{app}{item}。允许使用带有点的名称。更新了模板文档,#254 - 更新包含的仪表盘。添加模板化的 zabbix 数据源并将其用于所有指标。
- groupBy() 函数性能提升(比旧版本快 6-10 倍)。
- 使用聚合时用 *null* 填充空间隔,#388
已修复
- 当键在带引号的参数中包含逗号时,项目名称展开,例如 my_key["a=1,b=2",c,d]
- 使用趋势时点顺序不正确 #202
- 触发器面板亮色主题样式
- singlestat 或表格显示 NaN 时的文本指标 bug,#325
[3.4.0] - 2017-05-17
已添加
- 告警:高亮显示包含触发了告警的指标的面板。
- 告警:将阈值从 zabbix 触发器添加到面板。
- 文档:添加来自 @v-zhuravlev 的 setAliasByRegex() 文档
- 图表支持毫秒分辨率。来自 Jay Dawes ajaxous@gmail.com 的补丁。
- Sum 和 count 聚合。
- 在项目中展开用户宏 #212
- replaceAlias() 函数 #287
- 趋势的附加
Range配置选项 #364
已更改
- 将模板变量添加到指标下拉列表中 #310
- 将所有值正则表达式
/.*/添加到主机下拉列表中。 - 用 lodash 替换原生的 map() 和 forEach() 方法。
已修复
[3.3.0] - 2017-02-10
已添加
已更改
- 触发器面板:重新排列选项。
已修复
- Grunt:修复 watch 任务。
[3.2.1] - 2017-02-02
已添加
- 文档:添加构建说明。
- setAliasByRegex() 函数
已更改
- 文档:废弃包含已构建插件的特殊仓库。
- 触发器面板:从数据源列表中移除 'default'(导致错误),iss #340
- 将 dist/ 目录添加到仓库,以符合开发指南 http://docs.grafana.org/plugins/development/
已修复
- 触发器面板:指标建议。
- 触发器面板:事件确认。
- 触发器面板:面板样式。
- 查询编辑器:选项样式。
- 文档:修复 timeShift() 文档
- 新空面板的错误 #337
- 检查查询中的变量。
[3.2.0] - 2017-02-02 [YANKED]
已添加
- timeShift() 函数 #307