
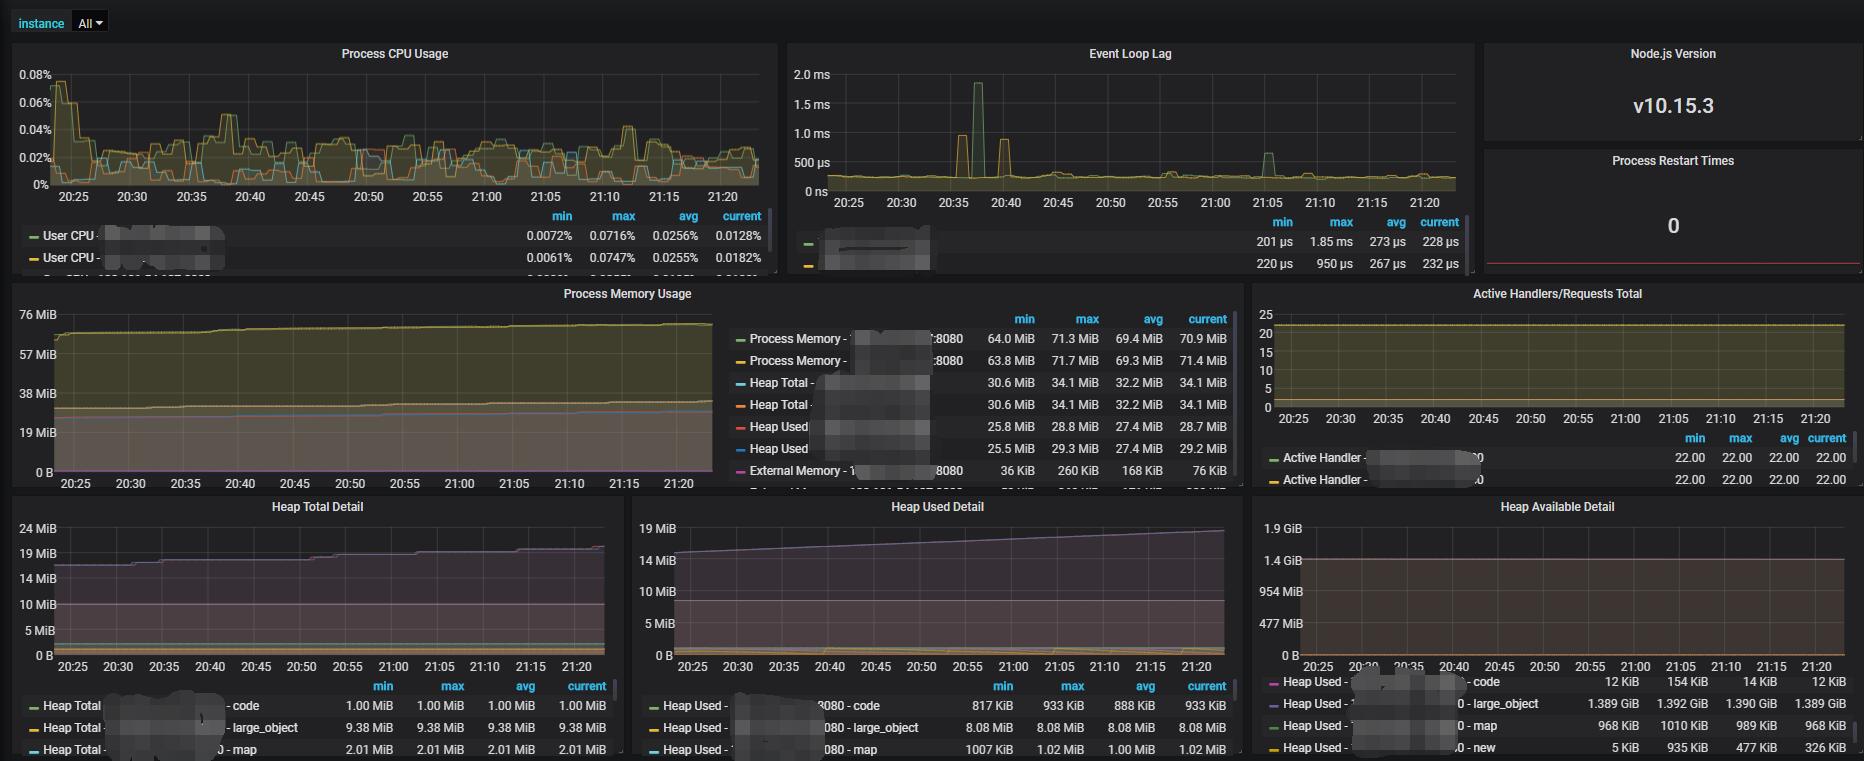
NodeJS 应用仪表盘
node.js prometheus 客户端基本指标
快速开始
步骤 1. 安装 Node.js Prometheus 客户端并采集默认指标
npm install prom-clientimport { collectDefaultMetrics } from 'prom-client';
collectDefaultMetrics({ timeout: 5000 });https://github.com/siimon/prom-client
步骤 2. 暴露您的指标端点并自定义您的指标
以 koa2(带有 pino logger)为例
import { yourRouter} from './routes';
import { collectDefaultMetrics, register, Counter, Gauge } from 'prom-client';
import Router = require('koa-router');

// tslint:disable-next-line: no-var-requires
const { startTime } = require('pino-http');

yourRouter.get('/metrics', (ctx) => {
  ctx.headers['content-type'] = register.contentType;
  ctx.body = register.metrics();
});

// Customized Http Metrics (Optional)
const httpMetricsLabelNames = ['method', 'path'];
const totalHttpRequestCount = new Counter({
  name: 'nodejs_http_total_count',
  help: 'total request number',
  labelNames: httpMetricsLabelNames
});
const totalHttpRequestDuration = new Gauge({
  name: 'nodejs_http_total_duration',
  help: 'the last duration or response time of last request',
  labelNames: httpMetricsLabelNames
});

function initMetrics4EachRoute(layer: Router.Layer) {
  layer.stack.unshift(async (ctx, next) => {
    await next();
    totalHttpRequestCount.labels(ctx.method, layer.path).inc();
    // start time symbol defined in pino-http
    totalHttpRequestDuration
      .labels(ctx.method, layer.path)
      .inc(new Date().valueOf() - (ctx.res as any)[startTime]);
  });
}

// call this function to intecept ALL routes with detailed HTTP metrics (Optional)
export function initRoutingMetrics() {
  yourRouter.stack.forEach(initMetrics4EachRoute);
}数据源配置
采集器类型:
采集器插件