Grafana 和 Prometheus 入门指南
Prometheus 是一个开源监控系统,Grafana 为其提供开箱即用的支持。本主题将引导您完成在 Grafana 中创建一系列仪表盘的步骤,以显示由 Prometheus 监控的服务器的系统指标。
提示
查看我们的 Prometheus 学习旅程。
- 在 Grafana Cloud 中连接到 Prometheus 数据源,以便直接从指标存储位置进行可视化。
- 使用 Prometheus remote write 将指标发送到 Grafana Cloud,以便在不显著更改现有配置的情况下探索 Grafana Cloud。
Grafana 和 Prometheus:
- 下载 Prometheus 和 Node exporter
- 安装 Prometheus Node exporter
- 安装和配置 Prometheus
- 为 Grafana 配置 Prometheus
- 在 Grafana Explore 视图中检查 Prometheus 指标
- 开始构建仪表盘
下载 Prometheus 和 Node exporter
下载以下组件
与 Grafana 一样,您可以在许多不同的操作系统上安装 Prometheus。请参阅 Prometheus 下载页面,查看 Prometheus 组件的稳定版本列表。
安装 Prometheus Node exporter
在所有您想要监控的主机上安装 Node exporter。本指南将向您展示如何在本地安装它。
Prometheus Node exporter 是一个广泛使用的工具,用于暴露系统指标。有关安装 Node exporter 的说明,请参阅 Prometheus 文档中的 安装和运行 Node exporter 部分。
当您在本地运行 Node exporter 时,导航到 https://:9100/metrics 检查它是否正在导出指标。
注意
所引用主题中的说明适用于 Linux 用户。您可能需要根据您的操作系统稍作修改。例如,如果您使用 Windows,请改用 windows_exporter。
安装和配置 Prometheus
下载 Prometheus 后,解压并导航到其目录。
tar xvfz prometheus-*.tar.gz
cd prometheus-*
在该目录中找到
prometheus.yml文件。修改 Prometheus 配置文件,以监控安装了 Node exporter 的主机。
默认情况下,Prometheus 会在当前工作目录中查找 prometheus.yml 文件。此行为可以通过 --config.file 命令行标志更改。例如,一些 Prometheus 安装程序使用它将配置文件设置为 /etc/prometheus/prometheus.yml。
以下示例显示了您应该添加的代码。请注意,当 Node exporter 在本地运行时,静态配置目标设置为 ['localhost:9100']。
 # A scrape configuration containing exactly one endpoint to scrape from Node exporter running on a host:
 scrape_configs:
     # The job name is added as a label `job=<job_name>` to any timeseries scraped from this config.
     - job_name: 'node'

     # metrics_path defaults to '/metrics'
     # scheme defaults to 'http'.

       static_configs:
       - targets: ['localhost:9100']
启动 Prometheus 服务
./prometheus --config.file=./prometheus.yml通过导航到
https://:9090确认 Prometheus 正在运行。
您可以看到 Node exporter 指标已发送到 Prometheus。接下来,这些指标将发送到 Grafana。
为 Grafana 配置 Prometheus
当在本地运行 Prometheus 时,有两种方法可以为 Grafana 配置 Prometheus。您可以使用 Grafana Cloud 上的托管 Grafana 实例,或在本地运行 Grafana。
本指南描述了如何在 Grafana Cloud 上的托管 Grafana 实例中配置 Prometheus。
- 注册 https://grafana.org.cn/。Grafana 会为您提供一个开箱即用的 Prometheus 实例。

- 因为您在本地运行自己的 Prometheus 实例,所以您必须将您的指标
remote_write到 Grafana.com 的 Prometheus 实例。Grafana 提供了可以添加到您的prometheus.yml配置文件的代码。这包括 remote write 端点、您的用户名和密码。
将以下代码添加到您的 prometheus.yml 文件中,开始将指标发送到您的托管 Grafana 实例。
remote_write:
- url: <https://your-remote-write-endpoint>
  basic_auth:
    username: <your user name>
password: <Your Grafana.com API Key>故障排除
如果 Prometheus 未按预期运行或功能异常,您可以尝试以下一些故障排除步骤。此处提供的步骤是基于我们为 Prometheus 提供的学习旅程精选的。如果您想进一步探索,如果您想在不将数据发送或存储到 Grafana Cloud 的情况下(例如出于本地保留需求)在 Grafana Cloud 中可视化数据,请查看Prometheus 学习旅程。或者,如果您已经有 Prometheus 设置,并且想在不进行显著更改的情况下探索 Grafana Cloud,请访问Prometheus remote write 学习旅程。
1. 检查 Prometheus 是否正在运行
如果 Prometheus web UI 无法访问(例如,浏览器中出现“拒绝连接”错误)或 Prometheus 查询失败(例如,Grafana 中出现“数据源不可用”或“无数据点”等错误),一个好的起点是确认 Prometheus 进程和服务正在运行。
您可以通过检查系统进程或验证服务状态来完成此操作
Linux
sudo systemctl status prometheus- 显示进程是否正在运行以及服务是否处于活动状态。
MacOS
pgrep prometheus- 如果 Prometheus 正在运行,则返回进程 ID (PID)。
Windows (PowerShell)
Get-Process -Name prometheus -ErrorAction SilentlyContinue- 按名称检查 Prometheus 进程是否正在运行。
2. 如果 Prometheus 未运行
从检查常见原因开始
检查端口冲突.
Prometheus 默认运行在端口 9090 上。如果其他进程正在使用此端口,Prometheus 可能无法启动。您可以使用以下命令检查端口冲突:
Linux 和 MacOS
lsof -i :9090Windows (PowerShell)
netstat -ano | findstr :9090- 显示是否有其他进程正在使用端口 9090。
验证 Prometheus 二进制文件位置:确保 Prometheus 二进制文件 (prometheus 和 promtool) 已正确安装。
Linux 和 MacOS
ls /usr/local/bin/prometheus /usr/local/bin/promtool- 如果丢失,请将它们移动到
/usr/local/bin或您系统 PATH 中的目录。
检查 Prometheus 是否在 PATH 中.
which prometheus
which promtool- 如果没有 输出,则二进制文件不在系统 PATH 中。
确保配置文件和数据文件到位.
Linux 和 MacOs
ls /etc/prometheus /var/lib/prometheus
ls /etc/prometheus/prometheus.yml- 确保 Prometheus 拥有必要的配置文件和数据存储目录。
检查权限:如果 Prometheus 作为专用用户运行,请确保所有权正确
sudo chown -R prometheus:prometheus /etc/prometheus /var/lib/prometheus(可选) 通过创建专用用户保护 Prometheus 安全
sudo useradd --no-create-home --shell /bin/false prometheus- 建议用于安全考虑:将 Prometheus 作为非登录用户运行。
3. 检查 Prometheus 是否作为服务运行
如果 Prometheus 作为进程运行,请检查它是否已正确设置并作为服务进行管理,以确保它在重启或故障后自动重启。
检查 Prometheus 服务状态
Linux
systemctl status prometheus.serviceWindows
sc query prometheusMacOs
pgrep prometheus- 如果服务处于 非活动状态(停止)或已停止,请继续执行后续步骤。
4. 如果 Prometheus 未作为服务运行
如果 Prometheus 未作为托管服务运行,请确保其已正确配置并能自动重启。
验证服务配置 (Linux 和 MacOs)
检查服务单元文件以确保路径正确
sudo nano /etc/systemd/system/prometheus.service- 查找
ExecStart行
ExecStart=/usr/local/bin/prometheus --config.file=/etc/prometheus/prometheus.yml --storage.tsdb.path=/var/lib/prometheus/- 确保
- 二进制文件路径 (
/usr/local/bin/prometheus) 正确。 - 配置文件 (
/etc/prometheus/prometheus.yml) 存在。 - 存储路径 (
/var/lib/prometheus/) 存在。
- 二进制文件路径 (
重启并启用 Prometheus 服务 (Linux 和 MacOs)
sudo systemctl daemon-reload
sudo systemctl enable prometheus
sudo systemctl start prometheus
sudo systemctl status prometheus
检查 Prometheus 健康状态
重启后,验证 Prometheus 是否响应
curl -s https://:9090/-/ready- 如果成功,则确认 Prometheus 已 准备好处理请求。
重启 Prometheus 服务 (Windows)
如果作为 Windows 服务运行,请重启它
net stop prometheus
net start prometheus
5. 检查 Prometheus 是否正在捕获指标
如果您安装了Node exporter 来暴露您的系统指标,您可以通过向 /metrics 端点发送请求来检查 Prometheus 是否正在捕获指标。
curl https://:9090/metrics- 它应该返回一些指标以及有关所暴露指标的元数据。
在 Grafana 指标下钻中检查 Prometheus 指标
在您的 Grafana 实例中,进入下钻视图,体验无需查询即可浏览 Prometheus 兼容指标。
开始构建仪表盘
现在您已经有了一系列精选的查询,可以创建仪表盘来渲染由 Prometheus 监控的系统指标。当您安装 Prometheus 和 Node exporter 或 windows_exporter 时,您会找到推荐的可用仪表盘。
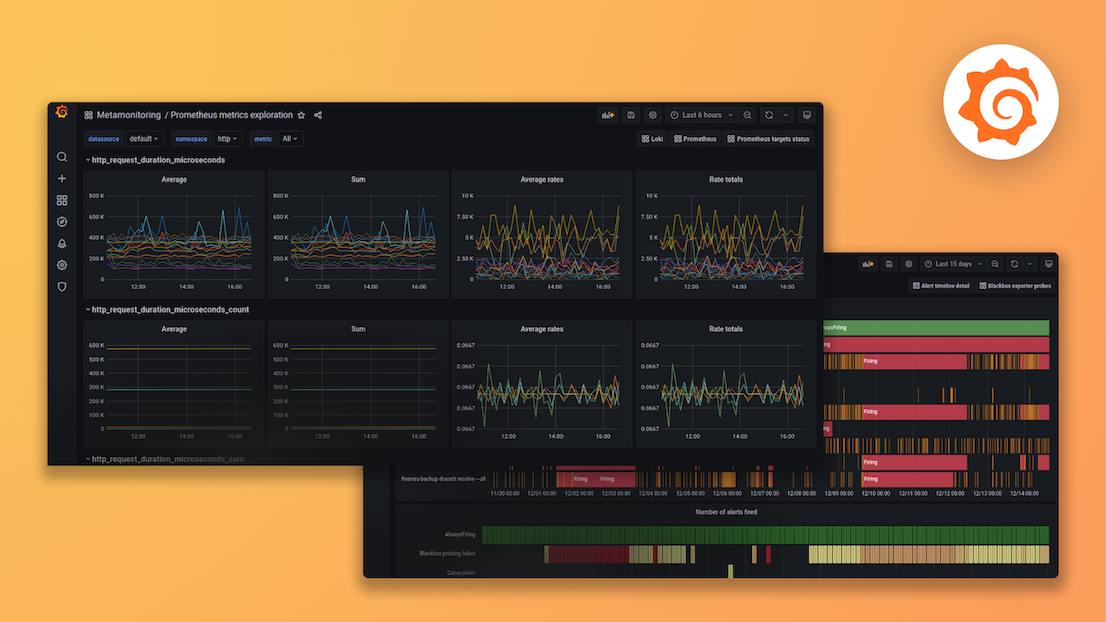
下图显示了一个仪表盘,其中包含三个面板,显示了一些系统指标。

了解更多
- Grafana 文档:Prometheus 数据源
- Prometheus 文档:什么是 Prometheus?