Grafana 的配置管理
Grafana 有一个活跃的配置管理系统,使用配置文件。这使得 GitOps 更加自然,因为数据源和仪表盘可以使用可版本控制的文件进行定义。
配置文件
有关可在 grafana.ini 中配置内容的更多信息,请参阅配置。
配置文件位置
Grafana 从 <WORKING DIRECTORY>/conf/defaults.ini 读取其默认配置。默认情况下,Grafana 从 <WORKING DIRECTORY>/conf/custom.ini 读取自定义配置。您可以使用 --config 选项覆盖自定义配置路径。
注意
Deb 和 RPM 包将配置文件安装在
/etc/grafana/grafana.ini。Grafana init.d 脚本将--config选项设置为该路径。
使用环境变量
您可以在所有配置管理配置中使用环境变量查找。环境变量的语法为 $ENV_VAR_NAME 或 ${ENV_VAR_NAME}。如果环境变量值中包含 $(例如,Pa$sw0rd),请使用 $ENV_VAR_NAME 语法以避免双重展开。您只能将环境变量用于配置值,而不能用于键或配置文件结构的较大组成部分。
您可以在仪表盘配置管理配置中使用环境变量,但不能在仪表盘定义文件本身中使用。
以下示例使用环境变量查找数据源 URL 端口、用户和密码
datasources:
  - name: Graphite
    url: https://:$PORT
    user: $USER
    secureJsonData:
      password: $PASSWORD
要转义配置管理文件值中的字面量 $,请使用 $$。
配置管理工具
Grafana 社区为许多流行的配置管理工具维护库。
数据源
您可以通过在 provisioning/datasources 目录中添加 YAML 配置文件来管理 Grafana 中的数据源。每个配置文件包含一个在启动期间添加或更新的数据源列表,位于 datasources 键下。如果数据源已经存在,Grafana 将重新配置它以匹配配置管理文件。
您还可以使用 deleteDatasources 键列出要自动删除的数据源。Grafana 在添加或更新 datasources 列表中的数据源之前删除 deleteDatasources 中列出的数据源。
您可以将 Grafana 配置为在从配置管理文件中移除已配置的数据源时自动删除它们。为此,请在数据源配置管理文件的根部添加 prune: true。使用此配置,如果您完全移除配置管理文件,Grafana 也会移除已配置的数据源。
运行多个 Grafana 实例
如果您运行多个 Grafana 实例,请在配置中为每个数据源添加版本号,并在更新配置时增加版本号。Grafana 只会更新版本号与配置文件中设置的版本号相同或更低的数据源。这可以防止在同时重启实例时,如果 datasource.yaml 文件有不同版本但未定义版本号,旧配置覆盖新配置。
数据源配置文件示例
此示例配置一个 Graphite 数据源
# Configuration file version
apiVersion: 1

# List of data sources to delete from the database.
deleteDatasources:
  - name: Graphite
    orgId: 1

# Mark provisioned data sources for deletion if they are no longer in a provisioning file.
# It takes no effect if data sources are already listed in the deleteDatasources section.
prune: true

# List of data sources to insert/update depending on what's
# available in the database.
datasources:
  # <string, required> Sets the name you use to refer to
  # the data source in panels and queries.
  - name: Graphite
    # <string, required> Sets the data source type.
    type: graphite
    # <string, required> Sets the access mode, either
    # proxy or direct (Server or Browser in the UI).
    # Some data sources are incompatible with any setting
    # but proxy (Server).
    access: proxy
    # <int> Sets the organization id. Defaults to orgId 1.
    orgId: 1
    # <string> Sets a custom UID to reference this
    # data source in other parts of the configuration.
    # If not specified, Grafana generates one.
    uid: my_unique_uid
    # <string> Sets the data source's URL, including the
    # port.
    url: https://:8080
    # <string> Sets the database user, if necessary.
    user:
    # <string> Sets the database name, if necessary.
    database:
    # <bool> Enables basic authorization.
    basicAuth:
    # <string> Sets the basic authorization username.
    basicAuthUser:
    # <bool> Enables credential headers.
    withCredentials:
    # <bool> Toggles whether the data source is pre-selected
    # for new panels. You can set only one default
    # data source per organization.
    isDefault:
    # <map> Fields to convert to JSON and store in jsonData.
    jsonData:
      # <string> Defines the Graphite service's version.
      graphiteVersion: '1.1'
      # <bool> Enables TLS authentication using a client
      # certificate configured in secureJsonData.
      tlsAuth: true
      # <bool> Enables TLS authentication using a CA
      # certificate.
      tlsAuthWithCACert: true
    # <map> Fields to encrypt before storing in jsonData.
    secureJsonData:
      # <string> Defines the CA cert, client cert, and
      # client key for encrypted authentication.
      tlsCACert: '...'
      tlsClientCert: '...'
      tlsClientKey: '...'
      # <string> Sets the database password, if necessary.
      password:
      # <string> Sets the basic authorization password.
      basicAuthPassword:
    # <int> Sets the version. Used to compare versions when
    # updating. Ignored when creating a new data source.
    version: 1
    # <bool> Allows users to edit data sources from the
    # Grafana UI.
editable: false有关特定数据源的配置管理示例,请参阅该数据源的文档。
JSON 数据
并非所有数据源都具有相同的配置设置,只有最常见的设置作为字段包含在数据源配置管理文件中。要配置数据源的其余设置,请将它们作为 JSON 包含在 jsonData 字段中。
内置核心数据源中的常见设置包括
| 名称 | 类型 | 数据源 | 描述 |
|---|---|---|---|
tlsAuth | 布尔值 | HTTP*, MySQL | 使用安全 JSON 数据中配置的客户端证书启用 TLS 身份验证 |
tlsAuthWithCACert | 布尔值 | HTTP*, MySQL, PostgreSQL | 使用 CA 证书启用 TLS 身份验证 |
tlsSkipVerify | 布尔值 | HTTP*, MySQL, PostgreSQL, MSSQL | 控制客户端是否验证服务器的证书链和主机名。 |
serverName | 字符串 | HTTP*, MSSQL | 可选。控制用于证书通用名/主题备用名验证的服务器名称。默认为使用数据源 URL。 |
timeout | 字符串 | HTTP* | 请求超时(秒)。覆盖 dataproxy.timeout 选项 |
graphiteVersion | 字符串 | Graphite | Graphite 版本 |
timeInterval | 字符串 | Prometheus, Elasticsearch, InfluxDB, MySQL, PostgreSQL 和 MSSQL | 应用于此数据源的最低间隔/步长值。 |
httpMode | 字符串 | InfluxDB | HTTP 方法。'GET', 'POST',默认为 GET |
maxSeries | 数字 | InfluxDB | Grafana 处理的最大序列/表数量 |
httpMethod | 字符串 | Prometheus | HTTP 方法。'GET', 'POST',默认为 POST |
customQueryParameters | 字符串 | Prometheus | 要添加的查询参数,作为 URL 编码字符串。 |
manageAlerts | 布尔值 | Prometheus 和 Loki | 通过告警 UI 管理告警 |
alertmanagerUid | 字符串 | Prometheus 和 Loki | 管理此数据源告警的 Alertmanager UID。 |
timeField | 字符串 | Elasticsearch | 应作为时间戳使用的字段 |
interval | 字符串 | Elasticsearch | 索引日期时间格式。nil(无模式),'Hourly'(每小时),'Daily'(每天),'Weekly'(每周),'Monthly'(每月)或 'Yearly'(每年) |
logMessageField | 字符串 | Elasticsearch | 应作为日志消息使用的字段 |
logLevelField | 字符串 | Elasticsearch | 应指示日志消息优先级的字段 |
maxConcurrentShardRequests | 数字 | Elasticsearch | 每个子搜索请求在每个节点上执行的最大并发分片请求数 |
sigV4Auth | 布尔值 | Elasticsearch 和 Prometheus | 启用 SigV4 使用 |
sigV4AuthType | 字符串 | Elasticsearch 和 Prometheus | SigV4 认证提供商。default/credentials/keys |
sigV4ExternalId | 字符串 | Elasticsearch 和 Prometheus | 可选 SigV4 外部 ID |
sigV4AssumeRoleArn | 字符串 | Elasticsearch 和 Prometheus | 可选 SigV4 ARN 角色承担 |
sigV4Region | 字符串 | Elasticsearch 和 Prometheus | SigV4 AWS 区域 |
sigV4Profile | 字符串 | Elasticsearch 和 Prometheus | 可选 SigV4 凭据配置文件 |
authType | 字符串 | Amazon CloudWatch | 认证提供商。default/credentials/keys |
externalId | 字符串 | Amazon CloudWatch | 可选外部 ID |
assumeRoleArn | 字符串 | Amazon CloudWatch | 可选 ARN 角色承担 |
defaultRegion | 字符串 | Amazon CloudWatch | 可选默认 AWS 区域 |
customMetricsNamespaces | 字符串 | Amazon CloudWatch | 自定义指标的命名空间 |
profile | 字符串 | Amazon CloudWatch | 可选凭据配置文件 |
tsdbVersion | 字符串 | OpenTSDB | 版本 |
tsdbResolution | 字符串 | OpenTSDB | 分辨率 |
sslmode | 字符串 | PostgreSQL | SSL 模式。'disable'(禁用),'require'(必需),'verify-ca'(验证 CA)或 'verify-full'(完全验证) |
tlsConfigurationMethod | 字符串 | PostgreSQL | SSL 证书配置,通过 'file-path' 或 'file-content' |
sslRootCertFile | 字符串 | PostgreSQL, MSSQL | SSL 服务器根证书文件,Grafana 用户必须可读 |
sslCertFile | 字符串 | PostgreSQL | SSL 客户端证书文件,Grafana 用户必须可读 |
sslKeyFile | 字符串 | PostgreSQL | SSL 客户端密钥文件,只有 Grafana 用户必须可读 |
encrypt | 字符串 | MSSQL | 确定 SSL 加密处理。选项包括:disable - 客户端和服务器之间发送的数据不加密;false - 客户端和服务器之间发送的数据在登录包之后不加密;true - 客户端和服务器之间发送的数据加密。默认为 false。 |
postgresVersion | 数字 | PostgreSQL | Postgres 版本号 (903/904/905/906/1000) 代表 v9.3, v9.4, …, v10 |
timescaledb | 布尔值 | PostgreSQL | 启用 TimescaleDB 扩展使用 |
maxOpenConns | 数字 | MySQL, PostgreSQL 和 MSSQL | 数据库的最大打开连接数 (Grafana v5.4+) |
maxIdleConns | 数字 | MySQL, PostgreSQL 和 MSSQL | 空闲连接池中的最大连接数 (Grafana v5.4+) |
connMaxLifetime | 数字 | MySQL, PostgreSQL 和 MSSQL | 连接可重用的最大时间(秒) (Grafana v5.4+) |
keepCookies | 数组 | HTTP* | 与数据源通信时需要传递的 Cookies |
prometheusVersion | 字符串 | Prometheus | Prometheus 数据源版本,例如 2.37.0, 2.24.0 |
prometheusType | 字符串 | Prometheus | Prometheus 数据库类型。选项包括 Prometheus, Cortex, Mimir 或Thanos。 |
cacheLevel | 字符串 | Prometheus | 确定浏览器缓存的持续时间。有效值包括:Low(低),Medium(中),High(高)和 None(无)。 |
incrementalQuerying | 字符串 | Prometheus | 实验性:开启增量查询以提高慢速数据源的仪表盘刷新性能 |
incrementalQueryOverlapWindow | 字符串 | Prometheus | 实验性:配置增量查询重叠窗口。需要有效的持续时间字符串,例如 180s 或 15m。默认值为 10m(10 分钟)。 |
disableRecordingRules | 布尔值 | Prometheus | 实验性:关闭 Prometheus 记录规则 |
implementation | 字符串 | Alertmanager | Alertmanager 数据源的实现,例如 prometheus, cortex 或 mimir |
handleGrafanaManagedAlerts | 布尔值 | Alertmanager | 启用后,Grafana 管理的告警将发送到此 Alertmanager |
注意
标记为 HTTP* 的数据源使用 HTTP 协议通信,其中包括所有核心数据源插件,但 MySQL、PostgreSQL 和 MSSQL 除外。
有关特定数据源的 JSON 数据示例,请参阅该数据源的文档。
安全 JSON 数据
安全 JSON 数据是一个使用密钥加密的设置映射。加密将 JSON 数据对 Grafana 用户隐藏。您应使用安全 JSON 数据存储数据源 HTTP 请求的 TLS 证书和密码。所有这些设置都是可选的。
| 名称 | 类型 | 数据源 | 描述 |
|---|---|---|---|
tlsCACert | 字符串 | HTTP*, MySQL, PostgreSQL | 出站请求的 CA 证书 |
tlsClientCert | 字符串 | HTTP*, MySQL, PostgreSQL | 出站请求的 TLS 客户端证书 |
tlsClientKey | 字符串 | HTTP*, MySQL, PostgreSQL | 出站请求的 TLS 客户端密钥 |
password | 字符串 | HTTP*, MySQL, PostgreSQL, MSSQL | password |
basicAuthPassword | 字符串 | HTTP* | 基本认证密码 |
accessKey | 字符串 | Amazon CloudWatch | 连接到 Amazon CloudWatch 的 Access Key |
secretKey | 字符串 | Amazon CloudWatch | 连接到 Amazon CloudWatch 的 Secret Key |
sigV4AccessKey | 字符串 | Elasticsearch 和 Prometheus | SigV4 access key。使用 keys 认证提供商时必需 |
sigV4SecretKey | 字符串 | Elasticsearch 和 Prometheus | SigV4 secret key。使用 keys 认证提供商时必需 |
注意
HTTP* 标签表示使用 HTTP 协议通信的数据源,包括所有核心数据源插件,但 MySQL、PostgreSQL 和 MSSQL 除外。
数据源的自定义 HTTP 头部
您可以向由 Grafana 配置管理的所有数据源发出的请求添加 HTTP 头部。在 jsonData 字段中配置头部名称,在 secureJsonData 中配置头部值。以下示例将 HeaderName 头部设置为 HeaderValue,将 Authorization 头部设置为 Bearer XXXXXXXXX
apiVersion: 1

datasources:
  - name: Graphite
    jsonData:
      httpHeaderName1: 'HeaderName'
      httpHeaderName2: 'Authorization'
    secureJsonData:
      httpHeaderValue1: 'HeaderValue'
      httpHeaderValue2: 'Bearer XXXXXXXXX'
插件
您可以通过在 provisioning/plugins 目录中添加一个或多个 YAML 配置文件来管理 Grafana 中的插件应用。每个配置文件包含 Grafana 在启动期间配置的应用列表。Grafana 配置每个应用以使用文件中的配置。
注意
此功能使您能够配置插件配置,而不是插件本身。您必须已安装插件才能使用插件配置管理功能。
插件配置文件示例
apiVersion: 1

apps:
  # <string> the type of app, plugin identifier. Required
  - type: raintank-worldping-app
    # <int> Org ID. Default to 1, unless org_name is specified
    org_id: 1
    # <string> Org name. Overrides org_id unless org_id not specified
    org_name: Main Org.
    # <bool> disable the app. Default to false.
    disabled: false
    # <map> fields that will be converted to json and stored in jsonData. Custom per app.
    jsonData:
      # key/value pairs of string to object
      key: value
    # <map> fields that will be converted to json, encrypted and stored in secureJsonData. Custom per app.
    secureJsonData:
      # key/value pairs of string to string
      key: value
仪表盘
您可以通过在 provisioning/dashboards 目录中添加一个或多个 YAML 配置文件来管理 Grafana 中的仪表盘。每个配置文件包含 Grafana 用于从本地文件系统加载仪表盘的提供商列表。
仪表盘配置文件示例
apiVersion: 1

providers:
  # <string> an unique provider name. Required
  - name: 'a unique provider name'
    # <int> Org id. Default to 1
    orgId: 1
    # <string> name of the dashboard folder.
    folder: ''
    # <string> folder UID. will be automatically generated if not specified
    folderUid: ''
    # <string> provider type. Default to 'file'
    type: file
    # <bool> disable dashboard deletion
    disableDeletion: false
    # <int> how often Grafana will scan for changed dashboards
    updateIntervalSeconds: 10
    # <bool> allow updating provisioned dashboards from the UI
    allowUiUpdates: false
    options:
      # <string, required> path to dashboard files on disk. Required when using the 'file' type
      path: /var/lib/grafana/dashboards
      # <bool> use folder names from filesystem to create folders in Grafana
      foldersFromFilesStructure: true
Grafana 启动时,会更新或创建配置路径中找到的所有仪表盘。随后,它会每隔 updateIntervalSeconds 轮询该路径以查找仪表盘文件的更新并更新其数据库。
注意
如果您未设置
folder字段,Grafana 会将仪表盘安装在根级别。
对已配置的仪表盘进行更改
您可以在 Grafana UI 中对已配置的仪表盘进行更改,但无法自动将更改保存回配置管理源。如果 allowUiUpdates 设置为 true 并且您更改了已配置的仪表盘,当您保存仪表盘时,Grafana 会将更改持久化到其数据库。
注意
如果您在 UI 中保存了已配置的仪表盘,然后又更新了配置管理源,Grafana 始终会使用配置管理文件中的仪表盘覆盖数据库中的仪表盘。Grafana 会忽略 JSON 文件中的
version属性,即使它低于数据库中的仪表盘版本。
注意
如果您在 UI 中保存已配置的仪表盘并删除了配置管理源,除非您已将
disableDeletion选项设置为true,否则 Grafana 会删除数据库中的仪表盘。
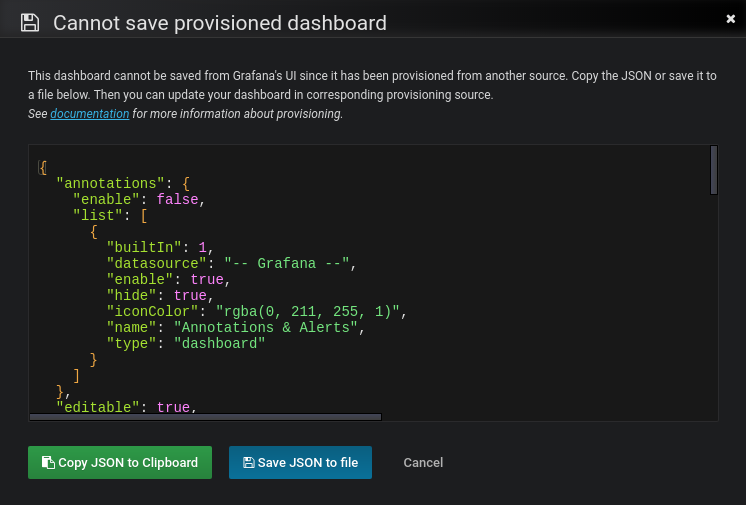
如果您将 allowUiUpdates 设置为 false,则无法保存对已配置仪表盘的更改。当您尝试保存对已配置仪表盘的更改时,Grafana 会弹出“无法保存已配置的仪表盘”对话框。
Grafana 提供导出仪表盘 JSON 定义的选项。使用复制 JSON 到剪贴板或将 JSON 保存到文件来将您的仪表盘更改同步回配置管理源。Grafana 会从仪表盘 JSON 中移除 id 字段,以帮助配置管理工作流程。
以下截图说明了此行为。
可复用仪表盘 URL
如果 JSON 文件中的仪表盘包含 UID,Grafana 会更新数据库中具有该 UID 的仪表盘。这使您可以在 Grafana 实例之间迁移仪表盘并保持一致的仪表盘 URL。Grafana 启动时,会创建或更新配置文件夹中所有可用的仪表盘。
注意
您可以使用配置管理覆盖现有仪表盘。
注意不要在同一文件夹内多次重用相同的
title或在同一 Grafana 实例内重用相同的uid,以免出现不一致的行为。
从文件系统到 Grafana 的文件夹结构配置
如果您已将仪表盘使用文件夹存储在 Git 仓库或文件系统中,并希望在 Grafana 菜单中拥有相同的文件夹名称,请使用 foldersFromFilesStructure 选项。
例如,要将以下仪表盘结构从文件系统复制到 Grafana
/etc/dashboards
├── /server
│   ├── /common_dashboard.json
│   └── /network_dashboard.json
└── /application
    ├── /requests_dashboard.json
    └── /resources_dashboard.json
使用以下配置管理配置文件
apiVersion: 1

providers:
  - name: dashboards
    type: file
    updateIntervalSeconds: 30
    options:
      path: /etc/dashboards
      foldersFromFilesStructure: true
Grafana 在 UI 中创建 server 和 application 文件夹。
要使用 foldersFromFilesStructure,您必须取消设置 folder 和 folderUid 选项。
要将仪表盘配置到根级别,请将它们存储在您的 path 的根目录中。
注意
此功能不允许您创建嵌套的文件夹结构,即文件夹中包含文件夹。
告警
有关配置 Grafana 告警的信息,请参阅配置 Grafana 告警资源。
支持的设置
以下部分详细介绍了每种告警通知类型的支持设置和安全设置。在配置管理 YAML 中,对常规设置使用 settings,对安全设置使用 secure_settings。Grafana 会加密数据库中的安全设置。
Pushover 告警通知
| 名称 | 安全设置 |
|---|---|
apiToken | 是 |
userKey | 是 |
device | |
priority | |
okPriority | |
retry | |
expire | |
sound | |
okSound |
Discord 告警通知
| 名称 | 安全设置 |
|---|---|
url | 是 |
avatar_url | |
content | |
use_discord_username |
Slack 告警通知
| 名称 | 安全设置 |
|---|---|
url | 是 |
recipient | |
username | |
icon_emoji | |
icon_url | |
uploadImage | |
mentionUsers | |
mentionGroups | |
mentionChannel | |
token | 是 |
color |
VictorOps 告警通知
| 名称 |
|---|
url |
autoResolve |
Kafka 告警通知
| 名称 |
|---|
kafkaRestProxy |
kafkaTopic |
LINE 告警通知
| 名称 | 安全设置 |
|---|---|
token | 是 |
MQTT 告警通知
| 名称 | 安全设置 |
|---|---|
brokerUrl | |
clientId | |
topic | |
messageFormat | |
username | |
password | 是 |
retain | |
qos | |
tlsConfig |
TLS 配置
| 名称 | 安全设置 |
|---|---|
insecureSkipVerify | |
clientCertificate | 是 |
clientKey | 是 |
caCertificate | 是 |
PagerDuty 告警通知
| 名称 | 安全设置 |
|---|---|
integrationKey | 是 |
autoResolve |
Sensu 告警通知
| 名称 | 安全设置 |
|---|---|
url | |
source | |
handler | |
username | |
password | 是 |
SensuGo 告警通知
| 名称 | 安全设置 |
|---|---|
url | |
apikey | 是 |
entity | |
check | |
handler | |
namespace |
Prometheus Alertmanager 告警通知
| 名称 | 安全设置 |
|---|---|
url | |
basicAuthUser | |
basicAuthPassword | 是 |
Teams 告警通知
| 名称 | 安全设置 |
|---|---|
url |
钉钉 告警通知
| 名称 | 安全设置 |
|---|---|
url |
电子邮件 告警通知
| 名称 | 安全设置 |
|---|---|
singleEmail | |
addresses |
HipChat 告警通知
| 名称 | 安全设置 |
|---|---|
url | |
apikey | |
roomid |
Opsgenie 告警通知
| 名称 | 安全设置 |
|---|---|
apiKey | 是 |
apiUrl | |
autoClose | |
overridePriority | |
sendTagsAs |
Telegram 告警通知
| 名称 | 安全设置 |
|---|---|
bottoken | 是 |
chatid | |
uploadImage |
Threema 告警通知
| 名称 | 安全设置 |
|---|---|
gateway_id | |
recipient_id | |
api_secret | 是 |
Webhook 告警通知
| 名称 | 安全设置 |
|---|---|
url | |
http_method | |
username | |
password | 是 |
tls_config | |
hmac_config |
TLS 配置
| 名称 | 安全设置 |
|---|---|
insecureSkipVerify | |
clientCertificate | 是 |
clientKey | 是 |
caCertificate | 是 |
HMAC 签名配置
| 名称 | 安全设置 |
|---|---|
secret | 是 |
header | |
timestampHeader |
Google Chat 告警通知
| 名称 | 安全设置 |
|---|---|
url |
Cisco Webex Teams 告警通知
| 名称 | 安全设置 |
|---|---|
message | |
room_id | |
api_url | |
bot_token | 是 |
Grafana Enterprise
Grafana Enterprise 支持