
Grafana Alloy 中的第一个组件和标准库
本教程涵盖了 Alloy 配置语法和标准库的基础知识。它介绍了一个用于收集主机指标并将其发送到 Prometheus 的基本流水线。
开始之前
完成本教程需要
- 您必须设置一个 本地 Grafana 实例。
推荐阅读
Alloy 配置语法基础
一个 Alloy 配置文件包含三个元素
属性
用于配置单个设置的
key = value对。url = "https://:9090"表达式
表达式用于计算值。它们可以是常量值,例如
"localhost:9090"。它们也可以更复杂,例如引用组件的导出:prometheus.exporter.unix.targets。它们还可以是数学表达式:(1 + 2) * 3,或标准库函数调用:sys.env("HOME")。如果您好奇,可以在标准库文档中找到可用标准库函数的列表。块
块用于使用属性组或嵌套块配置组件。以下示例块可用于配置 Alloy 的日志输出
logging {
    level  = "debug"
    format = "json"
}
注意
默认日志级别为
info,默认日志格式为logfmt。尝试将其粘贴到
config.alloy中并运行<BINARY_FILE_PATH> run config.alloy查看效果。将 *<BINARY_FILE_PATH>* 替换为 Alloy 二进制文件的路径。恭喜您,您刚刚编写了第一个 Alloy 配置文件。此配置目前不会执行任何操作。下一步,您将向此配置添加一些功能。
注意
Alloy 语法中的注释以
//开头,仅限单行。例如:// 这是一个注释。
组件
组件是 Alloy 配置的构建块。它们通过配置和链接来创建用于收集、处理和输出遥测数据的流水线。组件通过 Arguments 进行配置,并具有可被其他组件引用的 Exports。
推荐阅读
示例流水线
看一看下面的简单流水线
local.file "example" {
    filename = sys.env("HOME") + "/file.txt"
}

prometheus.remote_write "local_prom" {
    endpoint {
        url = "https://:9090/api/v1/write"

        basic_auth {
            username = "admin"
            password = local.file.example.content
        }
    }
}
注意
所有可用组件的列表可在组件参考中找到。每个组件都有一个链接到其文档,其中包含对组件功能的描述、其参数、其导出以及示例。
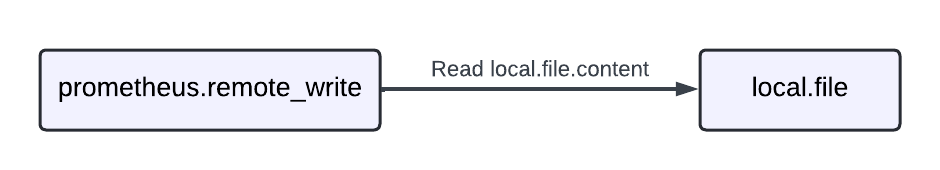
此流水线包含两个组件:local.file 和 prometheus.remote_write。local.file 组件通过一个参数 filename 进行配置,该参数通过调用 sys.env 标准库函数来获取 HOME 环境变量的值,并将其与字符串 "file.txt" 拼接。local.file 组件有一个导出 content,其中包含文件的内容。
prometheus.remote_write 组件通过一个 endpoint 块进行配置,该块包含 url 属性和一个 basic_auth 块。url 属性设置为 Prometheus remote write 端点的 URL。basic_auth 块包含 username 和 password 属性,分别设置为字符串 "admin" 和 local.file 组件的 content 导出。content 导出通过语法 local.file.example.content 进行引用,其中 local.file.example 是组件的完全限定名称(组件类型 + 标签),content 是导出名称。
注意
local.file组件的标签设置为"example",因此组件的完全限定名称是local.file.example。prometheus.remote_write组件的标签设置为"local_prom",因此组件的完全限定名称是prometheus.remote_write.local_prom。
此示例流水线目前仍未执行任何操作,因此是时候添加更多组件了。
发送您的第一个指标
既然您已经有了一个简单的流水线,就可以发送您的第一个指标了。
推荐阅读
修改您的流水线并抓取指标
构建一个简单的流水线,包含一个用于导出主机指标的 prometheus.exporter.unix 组件,一个用于抓取它的 prometheus.scrape 组件,以及一个用于将抓取的指标发送到 Prometheus 的 prometheus.remote_write 组件。
prometheus.exporter.unix "localhost" {
    // This component exposes a lot of metrics by default, so we will keep all of the default arguments.
}

prometheus.scrape "default" {
    // Setting the scrape interval lower to make it faster to be able to see the metrics
    scrape_interval = "10s"

    targets    = prometheus.exporter.unix.localhost.targets
    forward_to = [
        prometheus.remote_write.local_prom.receiver,
    ]
}

prometheus.remote_write "local_prom" {
    endpoint {
        url = "https://:9090/api/v1/write"
    }
}
使用以下命令运行 Alloy
<BINARY_FILE_PATH> run config.alloy替换以下内容
<BINARY_FILE_PATH>: Alloy 二进制文件的路径。
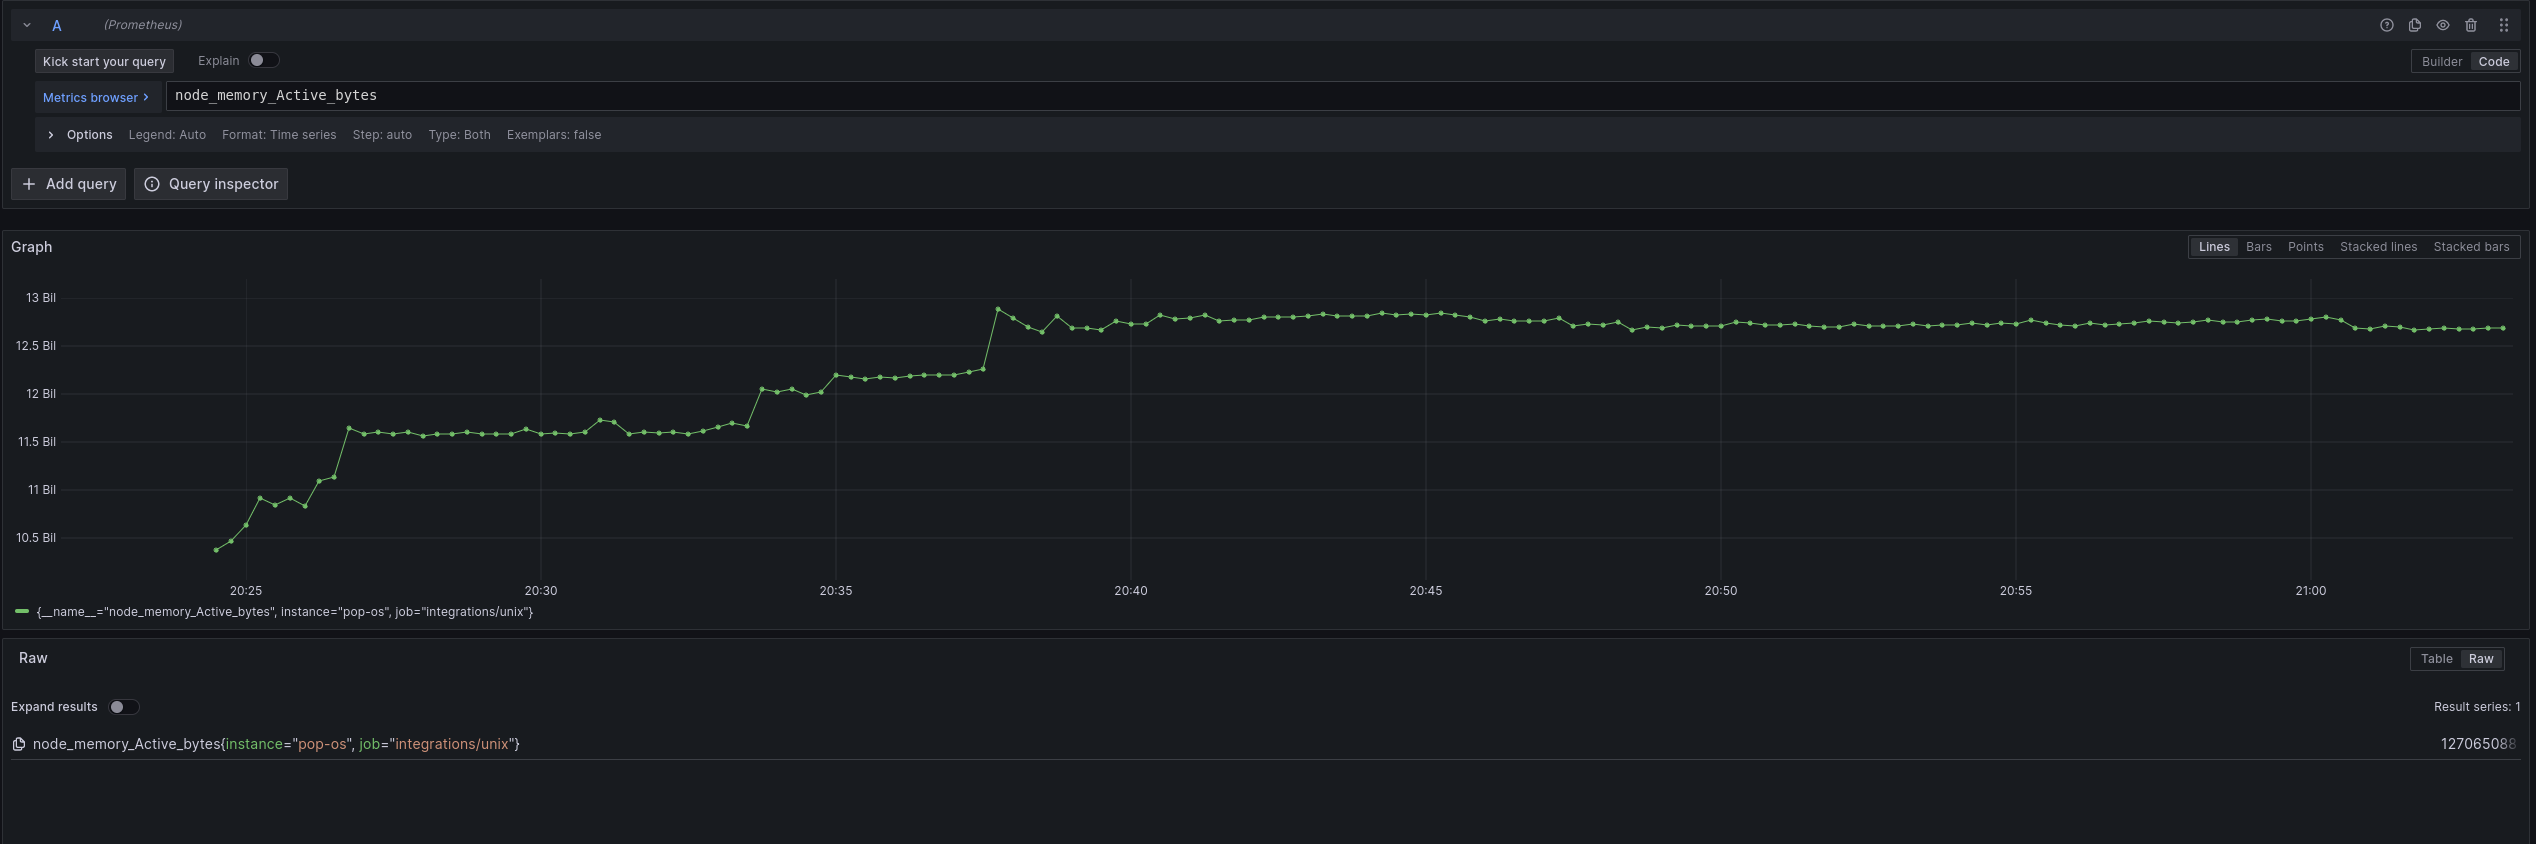
在浏览器中导航到 https://:3000/explore。大约 15-20 秒后,您应该能够看到来自 prometheus.exporter.unix 组件的指标。尝试查询 node_memory_Active_bytes 查看主机的活动内存。
可视化组件之间的关系
下图是一个示例流水线
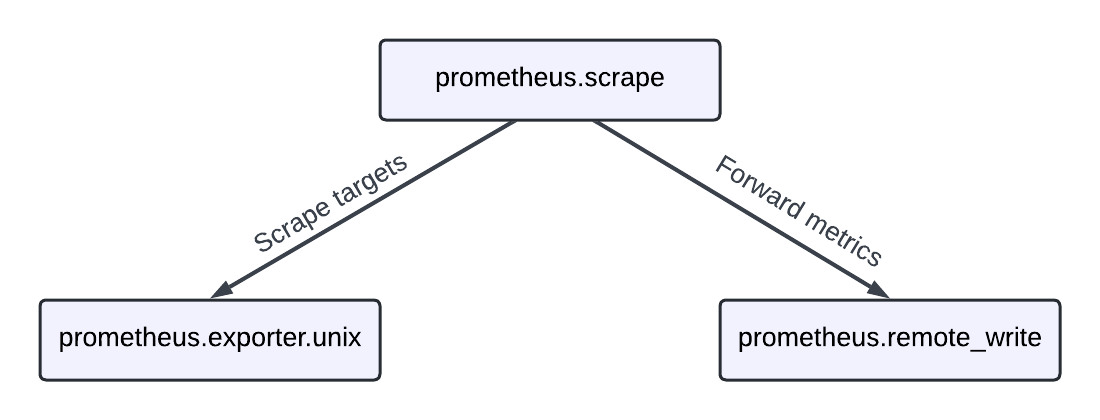
您的流水线配置定义了三个组件
prometheus.scrape- 一个从导出目标的组件中抓取指标的组件。prometheus.exporter.unix- 一个导出主机指标的组件,基于 node_exporter 构建。prometheus.remote_write- 一个将指标发送到与 Prometheus remote-write 兼容的端点的组件。
prometheus.scrape 组件引用了 prometheus.exporter.unix 组件的 targets 导出,这是一个抓取目标的列表。prometheus.scrape 组件将抓取的指标转发到 prometheus.remote_write 组件。
一个规则是组件不能形成循环。这意味着一个组件不能直接或间接引用自身。这是为了防止流水线中形成无限循环。
练习
以下练习将指导您修改流水线以从 Redis 中抓取指标。
推荐阅读
启动一个运行 Redis 的容器,并配置 Alloy 来抓取指标。
docker container run -d --name alloy-redis -p 6379:6379 --rm redis尝试修改流水线以从 Redis exporter 中抓取指标。您可以参考 prometheus.exporter.redis 组件文档,了解如何配置它。
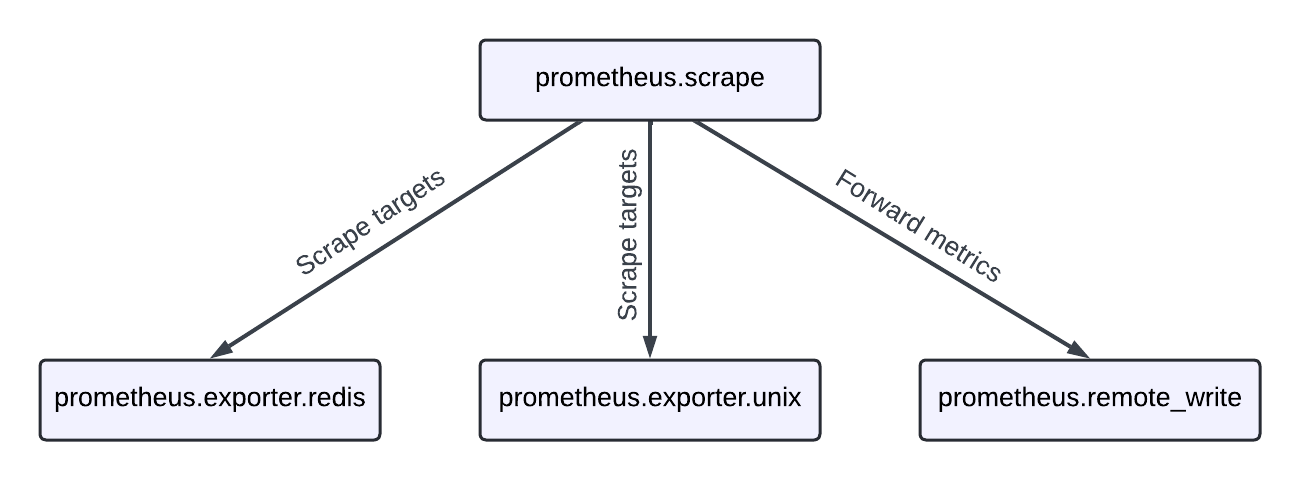
为了提供视觉提示,您需要创建一个看起来像这样的流水线
提示
请参考
array.concat标准库函数,了解如何将值列表合并为一个列表。
您可以使用以下命令运行带有新配置文件的 Alloy
<BINARY_FILE_PATH> run config.alloy替换以下内容
<BINARY_FILE_PATH>: Alloy 二进制文件的路径。
在浏览器中导航到 https://:3000/explore。首次抓取后,您应该能够查询 redis 指标和 node 指标。
要关闭 Redis 容器,请运行
docker container stop alloy-redis如果您遇到困难,可以随时在此处查看解决方案
// Configure your first components, learn about the standard library, and learn how to run Grafana Alloy

// prometheus.exporter.redis collects information about Redis and exposes
// targets for other components to use
prometheus.exporter.redis "local_redis" {
    redis_addr = "localhost:6379"
}

prometheus.exporter.unix "localhost" { }

// prometheus.scrape scrapes the targets that it is configured with and forwards
// the metrics to other components (typically prometheus.relabel or prometheus.remote_write)
prometheus.scrape "default" {
    // This is scraping too often for typical use-cases, but is easier for testing and demo-ing!
    scrape_interval = "10s"

    // Here, prometheus.exporter.redis.local_redis.targets refers to the 'targets' export
    // of the prometheus.exporter.redis component with the label "local_redis".
    //
    // If you have more than one set of targets that you would like to scrape, you can use
    // the 'array.concat' function from the standard library to combine them.
    targets    = array.concat(prometheus.exporter.redis.local_redis.targets, prometheus.exporter.unix.localhost.targets)
    forward_to = [prometheus.remote_write.local_prom.receiver]
}

// prometheus.remote_write exports a 'receiver', which other components can forward
// metrics to and it will remote_write them to the configured endpoint(s)
prometheus.remote_write "local_prom" {
    endpoint {
        url = "https://:9090/api/v1/write"
    }
}
总结和下一步
您可能已经注意到,使用配置文件运行 Alloy 会在您运行 Alloy 的目录中创建一个名为 data-alloy 的目录。这是组件可以存储数据的地方,例如 prometheus.exporter.unix 组件存储其预写日志 (WAL)。如果您查看该目录,有没有发现什么有趣的地方?每个组件的目录都是其完全限定名称。
如果您想将数据存储在其他位置,可以通过向 Alloy 的运行命令提供 --storage.path 标志来指定不同的目录,例如,<BINARY_FILE_PATH> run config.alloy --storage.path /etc/alloy。将 *<BINARY_FILE_PATH>* 替换为 Alloy 二进制文件的路径。通常,您可以使用一个持久化目录来存储数据,因为某些组件可能会利用存储在此目录中的数据来执行其功能。
在下一个教程中,您将学习如何配置 Alloy 从文件收集日志并将其发送到 Loki。您还将学习如何使用不同的组件处理指标和日志。
此页面有帮助吗?
Grafana Labs 的相关资源


